
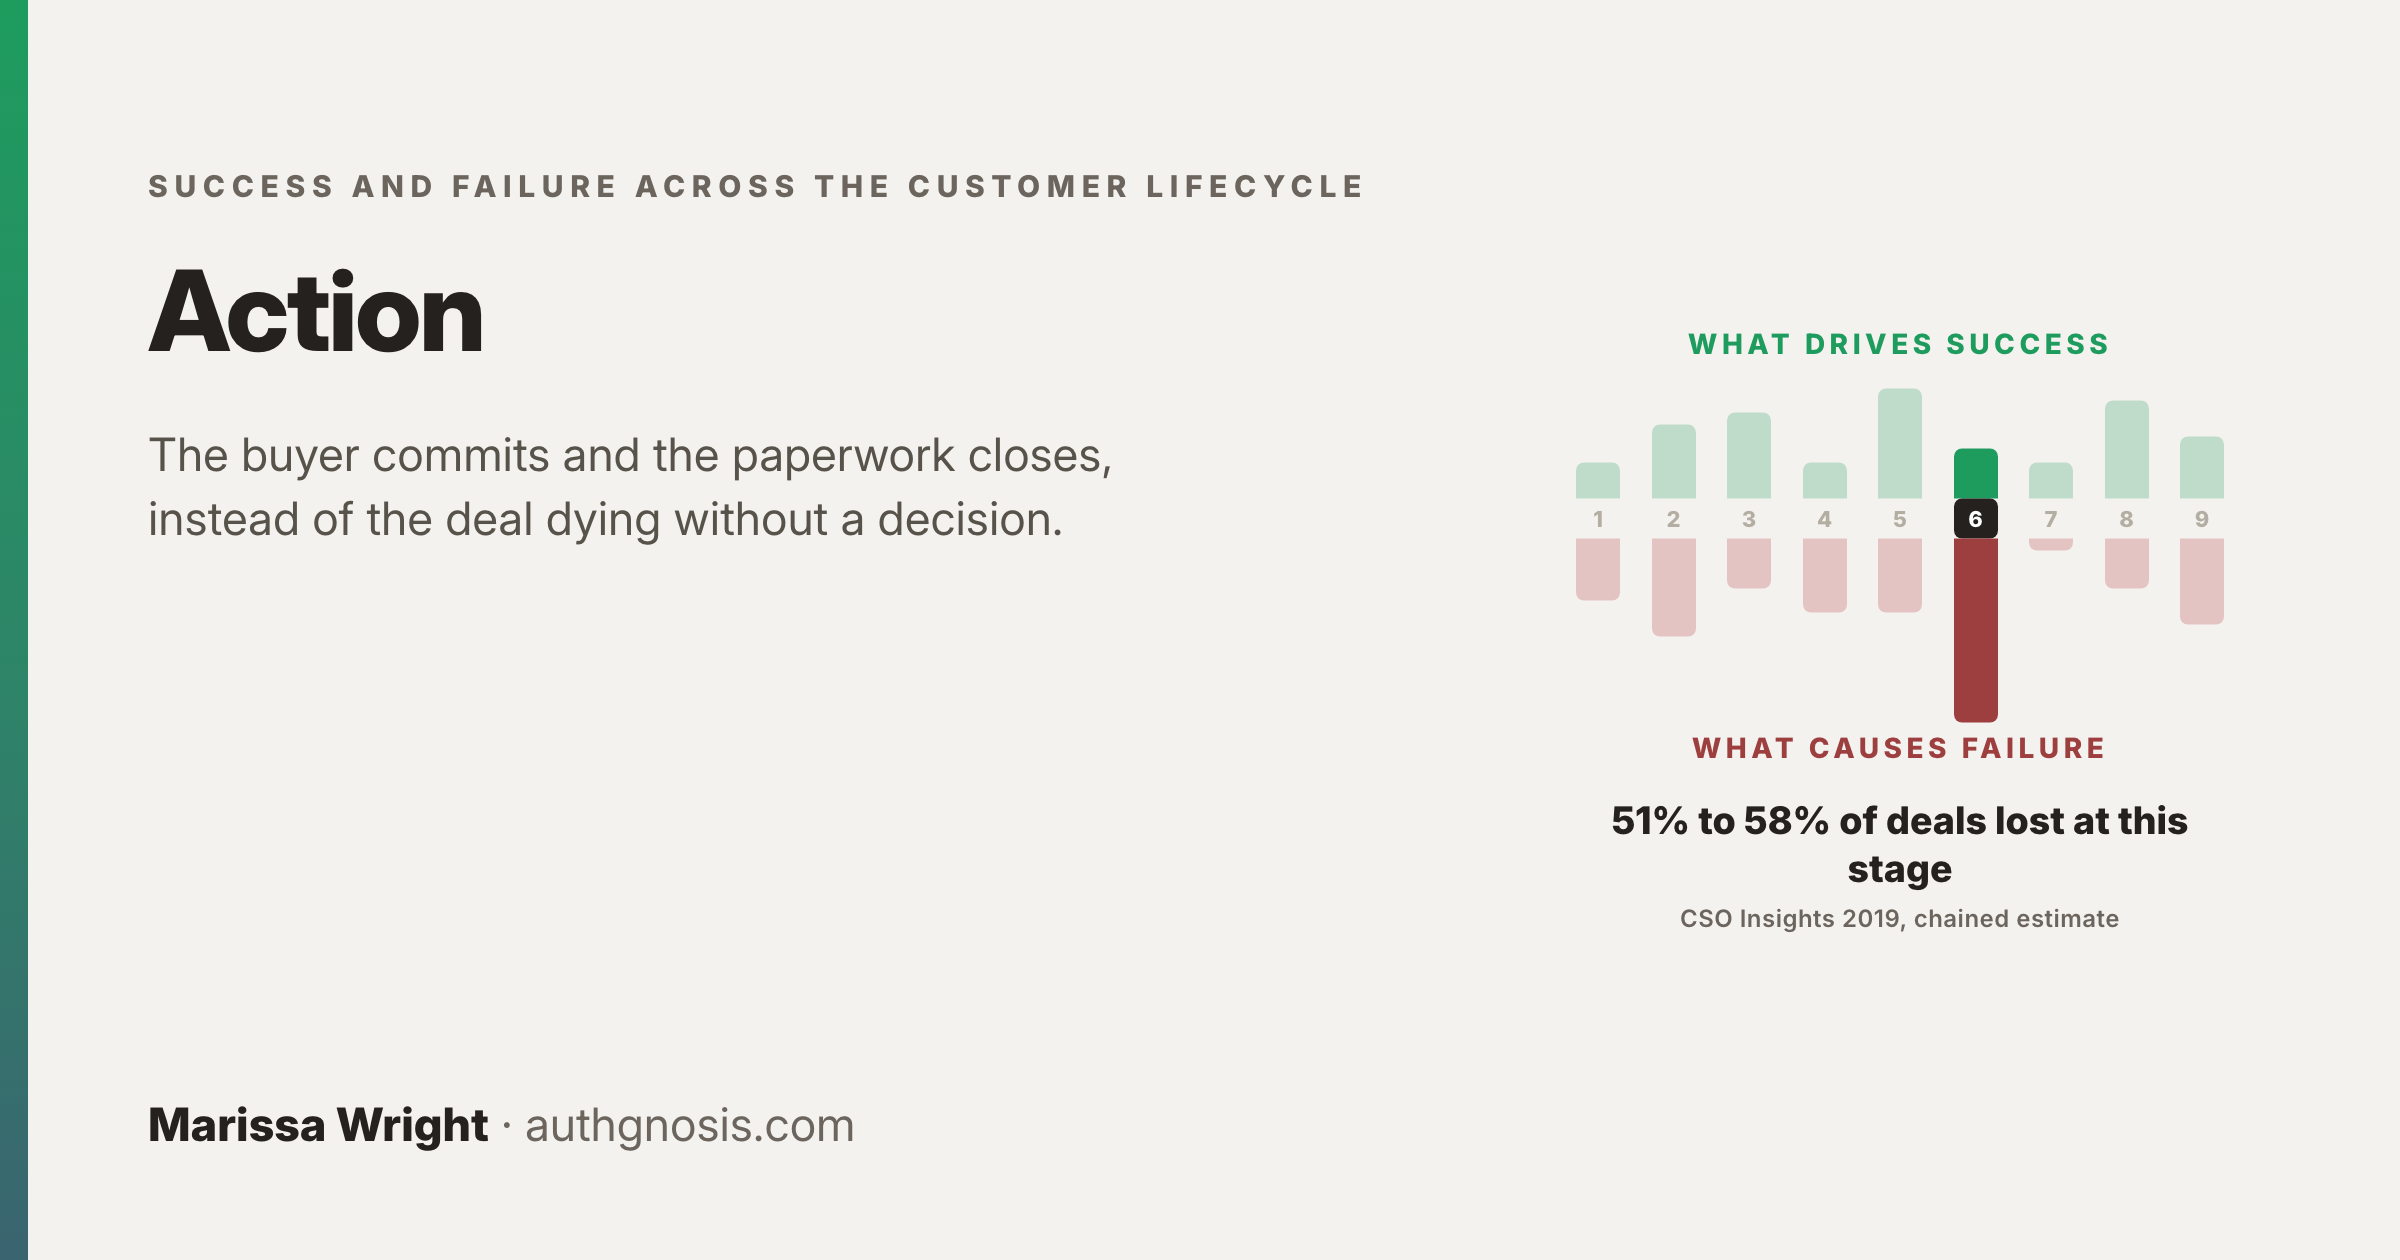
This post is part of Success and Failure across the Customer Lifecycle, which tests each stage of the AISDALS/L customer lifecycle against 172 data points from 98 primary sources. The lifecycle itself is set out in the series that begins with Integrating Sales Processes and a CLTV-Focused Customer Lifecycle.
Between 51% and 58% of deals fail at Action, and 40% to 60% of lost deals are lost to no decision (Dixon and McKenna 2022). With indecisive buyers, urgency tactics cut win rates by 84%, while risk mitigation and a clear recommendation each more than double them (Dixon and McKenna 2022).
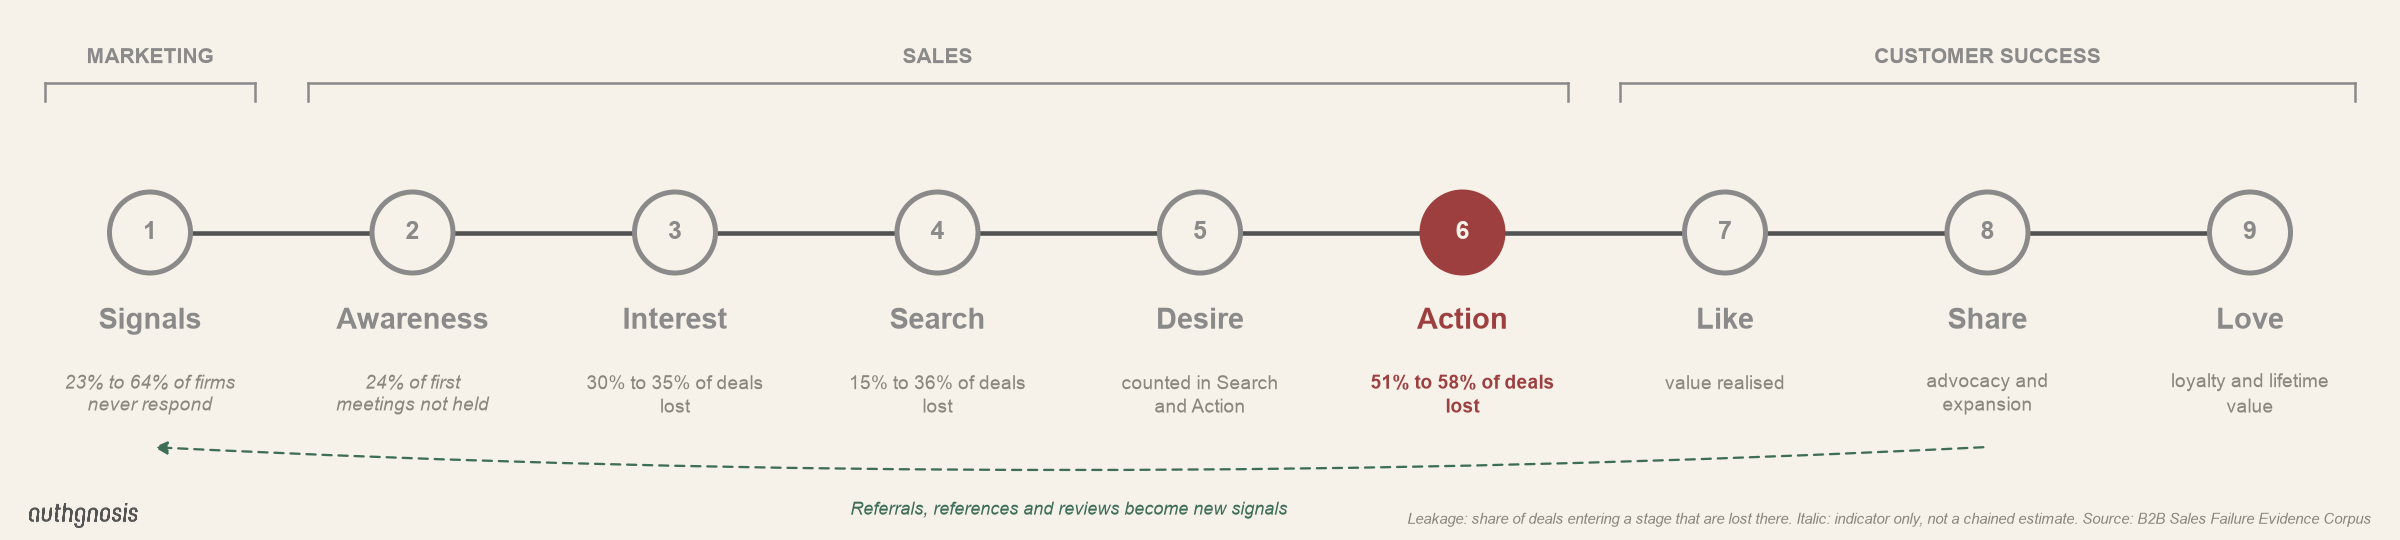
What the evidence covers
The Action evidence is plentiful but concentrated. It's strong on how often things happen, weaker on why, and thin on proof that any intervention causes a better result.
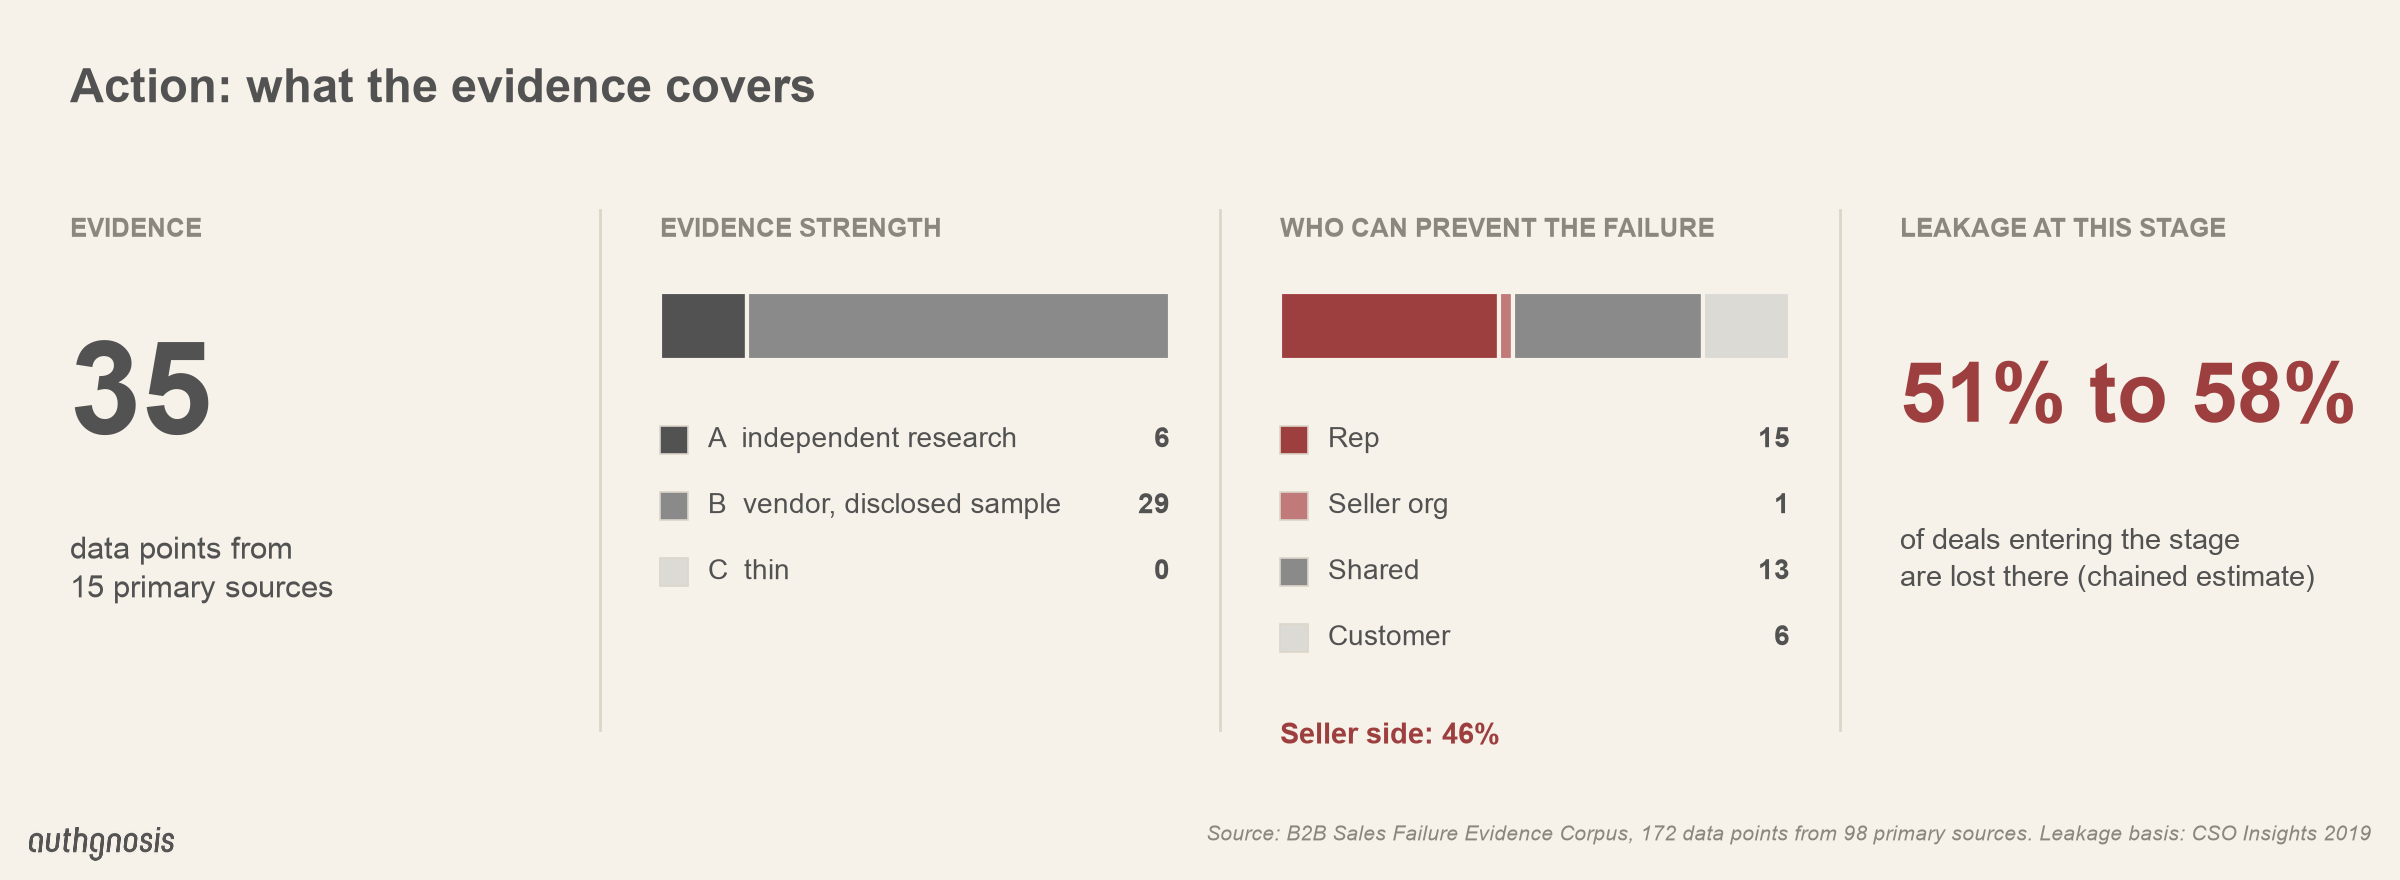
51% - 58% of deals fail through this stage.
Success at Action
The buyer commits and the paperwork closes on the date in the Close Map. This runs from Economic Buy-In, where the Forecast moves to Best Case, through the final stretch:
- The budget is confirmed as available within the timeline;
- A Close MAP is complete and agreed-to by all stakeholders;
- The package goes to legal for pre-clearance, and the Virtual Close asks for concurrence on the proposal as currently drafted;
- Commercial terms and legal clear, which moves the Forecast to Committed;
- The signable package goes out and the signed agreement and PO come back, which closes the deal as Won.
Failure at Action
This is not about losing to a competitor. It's the deal dying without a decision:
Half of forecast deals never close: of every 100, 47 are won, 32 are lost and 21 end in no decision (CSO Insights and Miller Heiman 2019; CSO Insights 2019; CSO Insights 2014). No decision accounts for 40% to 60% of lost deals, and more of it comes from indecision than from preferring the status quo (Dixon and McKenna 2022).

In Lightspeed's data, 53% of losses were the prospect deciding to take no action, 39% the prospect going silent, and only 27% choosing a competitor (Lightspeed Venture Partners 2024).
87% of opportunities show moderate or high indecision (Dixon and McKenna 2022).
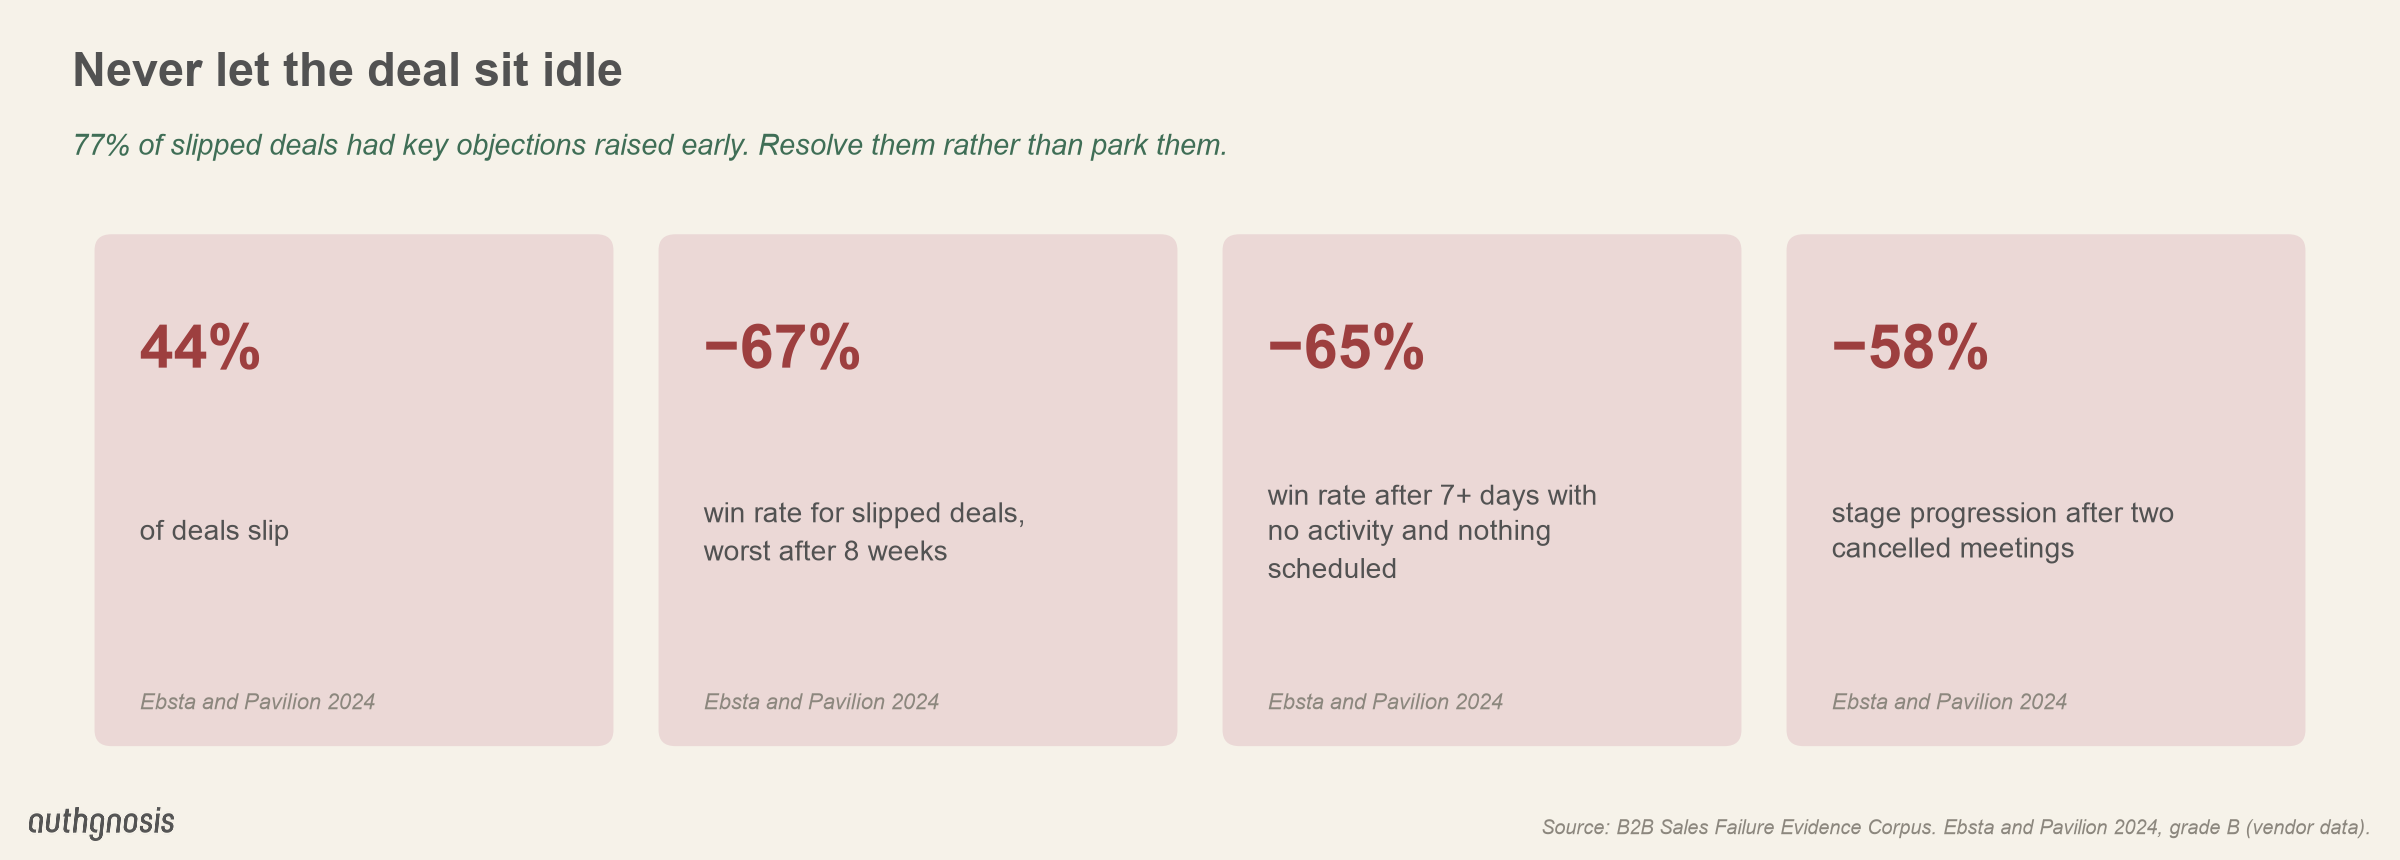
Deals that slip or go quiet lose most of their chance of winning: 44% of deals slip, and slipped deals' win rates fall 67% (Ebsta and Pavilion 2024).
In large sales, pressure to close backfires: after closing-technique training, high-value sales fell from 42% to 33% of transactions (Rackham 1988).

What sits within the seller's control
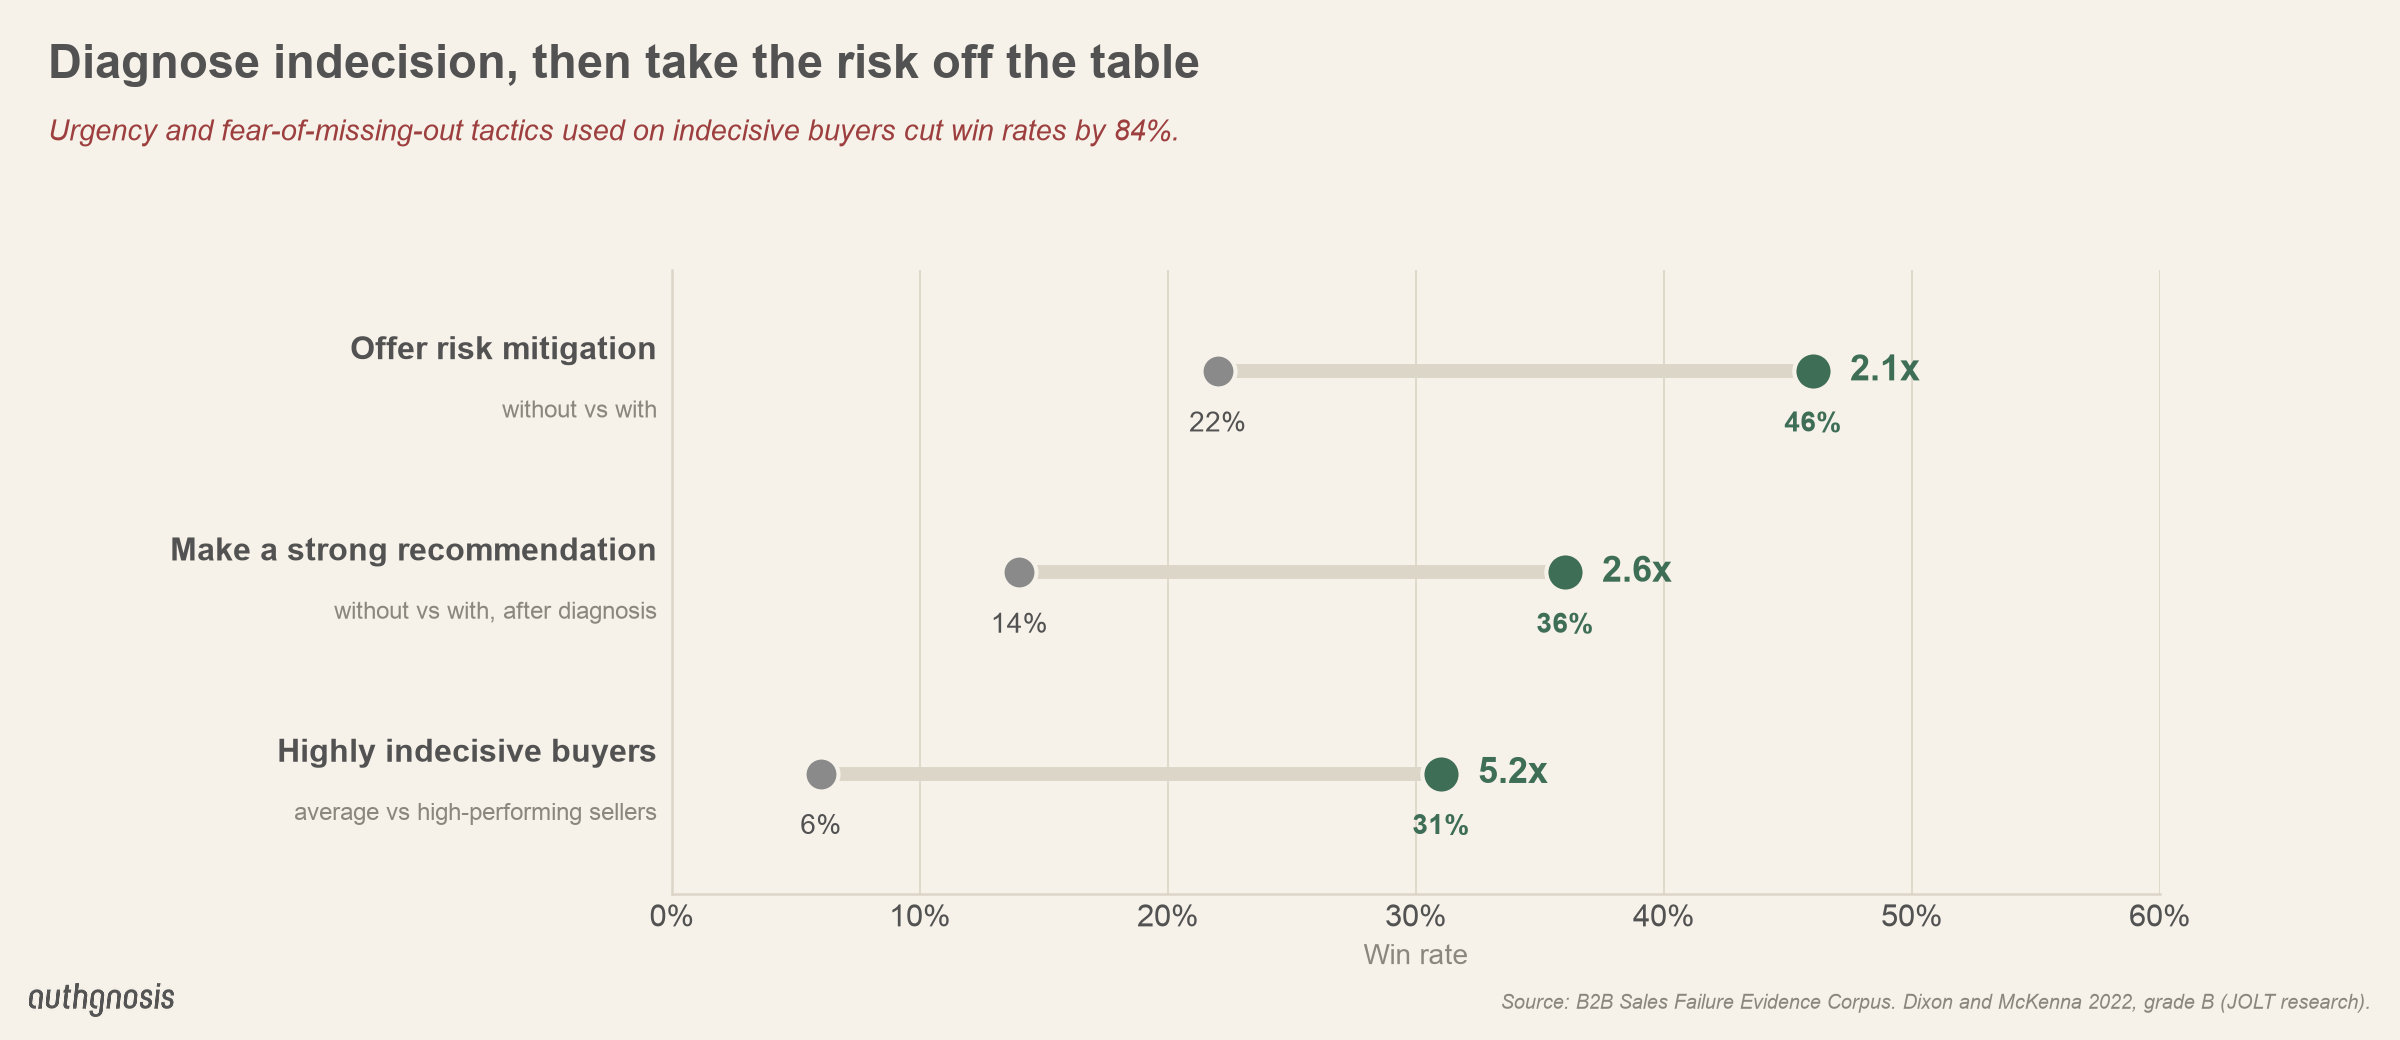
- Diagnose indecision before pushing. This is the most important lever at the stage. The JOLT effect research shows that the usual status-quo playbook of urgency and fear of missing out cuts win rates by 84% when the buyer is actually indecisive (Dixon and McKenna 2022). Indecisive buyers fear a wrong choice; they already want to act.
- Make a clear recommendation. A strong recommendation after diagnosis (e.g., the outcome of detailed discovery) raised win rates from 14% to 36% (Dixon and McKenna 2022). The rep narrows the options down to one, rather than adding more choices.
- Take the risk off the table. Offering risk mitigation raised win rates from 22% to 46% (Dixon and McKenna 2022). That could mean a phased scope, a phased pilot, success criteria tied to the SOW, or go/no-go options on a phased roll-out. Set side by side, both levers more than double win rates, and high performers win 31% of highly indecisive deals against 6% for average reps (Dixon and McKenna 2022).
- Build the buyer's confidence, not your urgency. Buyers with high decision confidence are 10 times likelier to make a high-quality, low-regret purchase (Gartner 2021, grade A). A Close MAP and concurrence build confidence.
- Ask for concurrence, not the close. Rackham's closing results (Rackham 1988) support a Virtual Close after a final Key Stakeholder concurrence meeting: the rep is asking the Economic Buyer to confirm the plan they've already agreed to. Closing “techniques” only helped in small, low-value sales (Rackham 1988).
- Never let the deal sit idle. Always leave each activity with a next activity scheduled, and rebook a cancelled meeting immediately (Ebsta and Pavilion 2024). The use of a MAP throughout the process raises the next task at every step; track idle days against known-good to surface risk from customer indecision and stakeholder disagreement.
- Resolve early objections, don't park them. 77% of slipped deals had key objections raised early (Ebsta and Pavilion 2024). The rep tracks every open objection in the CRM through to closure before a Close MAP goes out.
- Forecast from buyer evidence. The CRM flow sets Forecast thresholds and forecastability, never the rep, and remediates the "half of forecast deals don't close" finding.
Where Action fits in the AISDALS/L lifecycle
Action is the sixth of the nine stages described in The Nine Stages of the AISDALS/L Enterprise Sales Lifecycle. The exit criteria and forecast rules that decide when a deal moves to Committed are covered in Exit Criteria, Forecast Quality, and a CLTV Growth Flywheel. The Sales Process-Customer Lifecycle CRM Visualization shows the process behind every stage.
How I can help
Through my Authgnosis consulting practice, I design and implement integrated sales, marketing, and customer success processes in your CRM system. I bring over 25 years of revenue leadership experience, data-evidenced research, best-in-class processes and methodologies, and my hands-on development and integration skills to plug pipeline leakage, reduce customer churn, and enable dependable revenue forecasts. If you would like to discuss your sales, marketing, and customer delivery challenges, reach out to me here.