
Portfolio
Here you'll see examples of some of my client deliverables.
As you will see, I have a wide range of hands-on skill sets in business process analysis, mapping, web development, integration, content development, market messaging, data analytics, and financial modeling.

Dashboard design for cross-functional revenue, product, market, and customer acquisition KPIs


Examples of Work
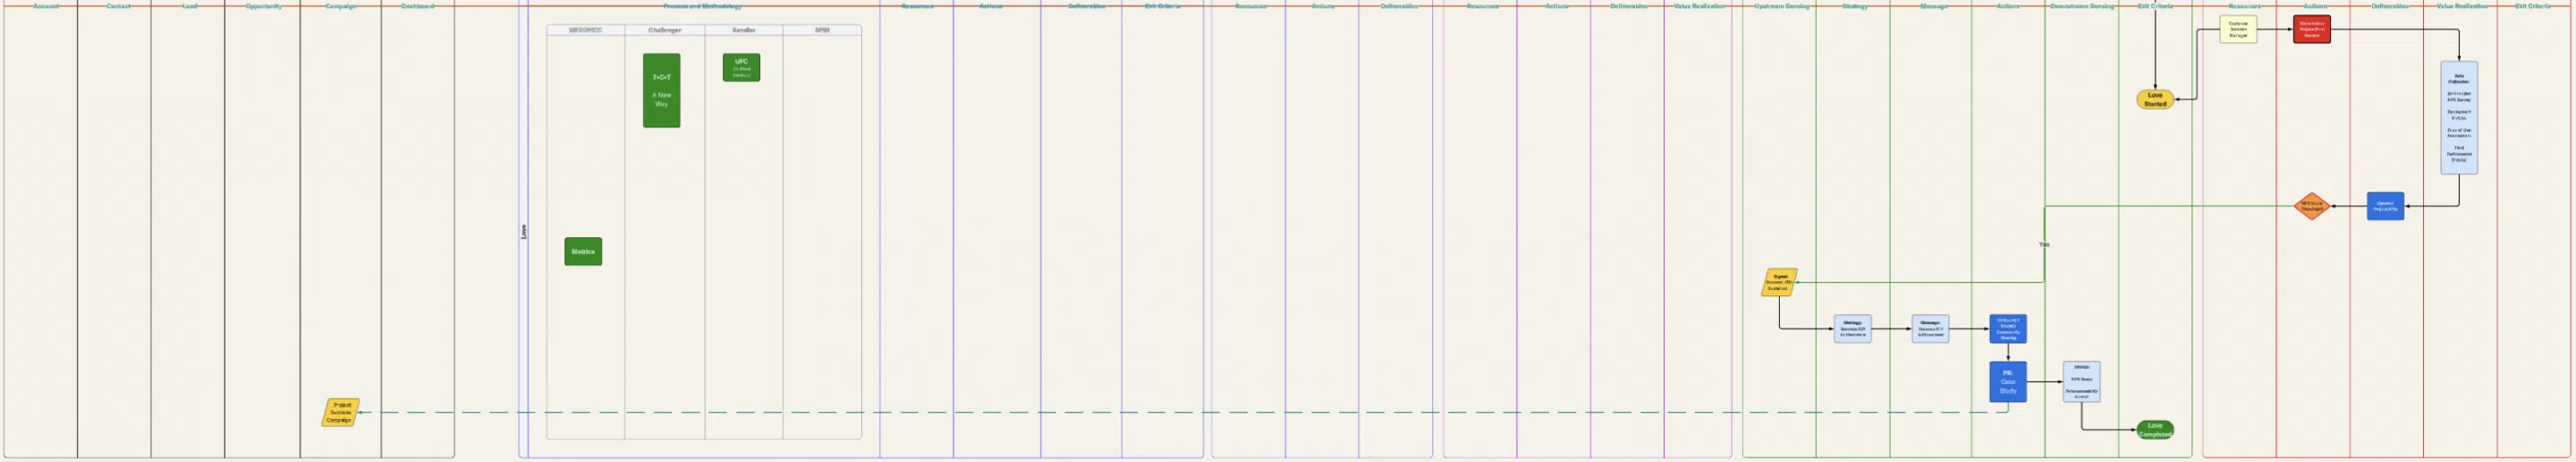
Sales and Marketing Process Design
I created this methodology to map against AISDALS/Love, a modern evolution of the classic AIDA/AIDAS marketing model. AISDALS/L better reflects a continuous flywheel for the revenue operations lifecycle.
AISDALS/L recognizes that customers search, evaluate, experience, and share their experiences with their peer community that signals long-term loyalty.
I’ve adapted the AISDALS/L lifecycle to enterprise revenue operations, where the focus becomes growing Customer Lifetime Value (CLTV) within existing customers rather than simply closing deals Average Contract Value (ACV) across a territory.
At an execution level, this process integrates marketing and sales using PQL and MQL data to identify real opportunities and support an active sales motion.
Sales is then guided by an integrated framework based on MEDDPICC, Challenger, Sandler, and SPIN Selling to control sales process quality, and predictable outcomes.
The process is tightly integrated with delivery and customer success, including external partners, to create value for customers and a "land-and-expand" customer lifecycle.
By mapping the entire lifecycle end-to-end, the organization gains clear visibility and control over revenue operations, enabling continuous improvement and improved scalability.
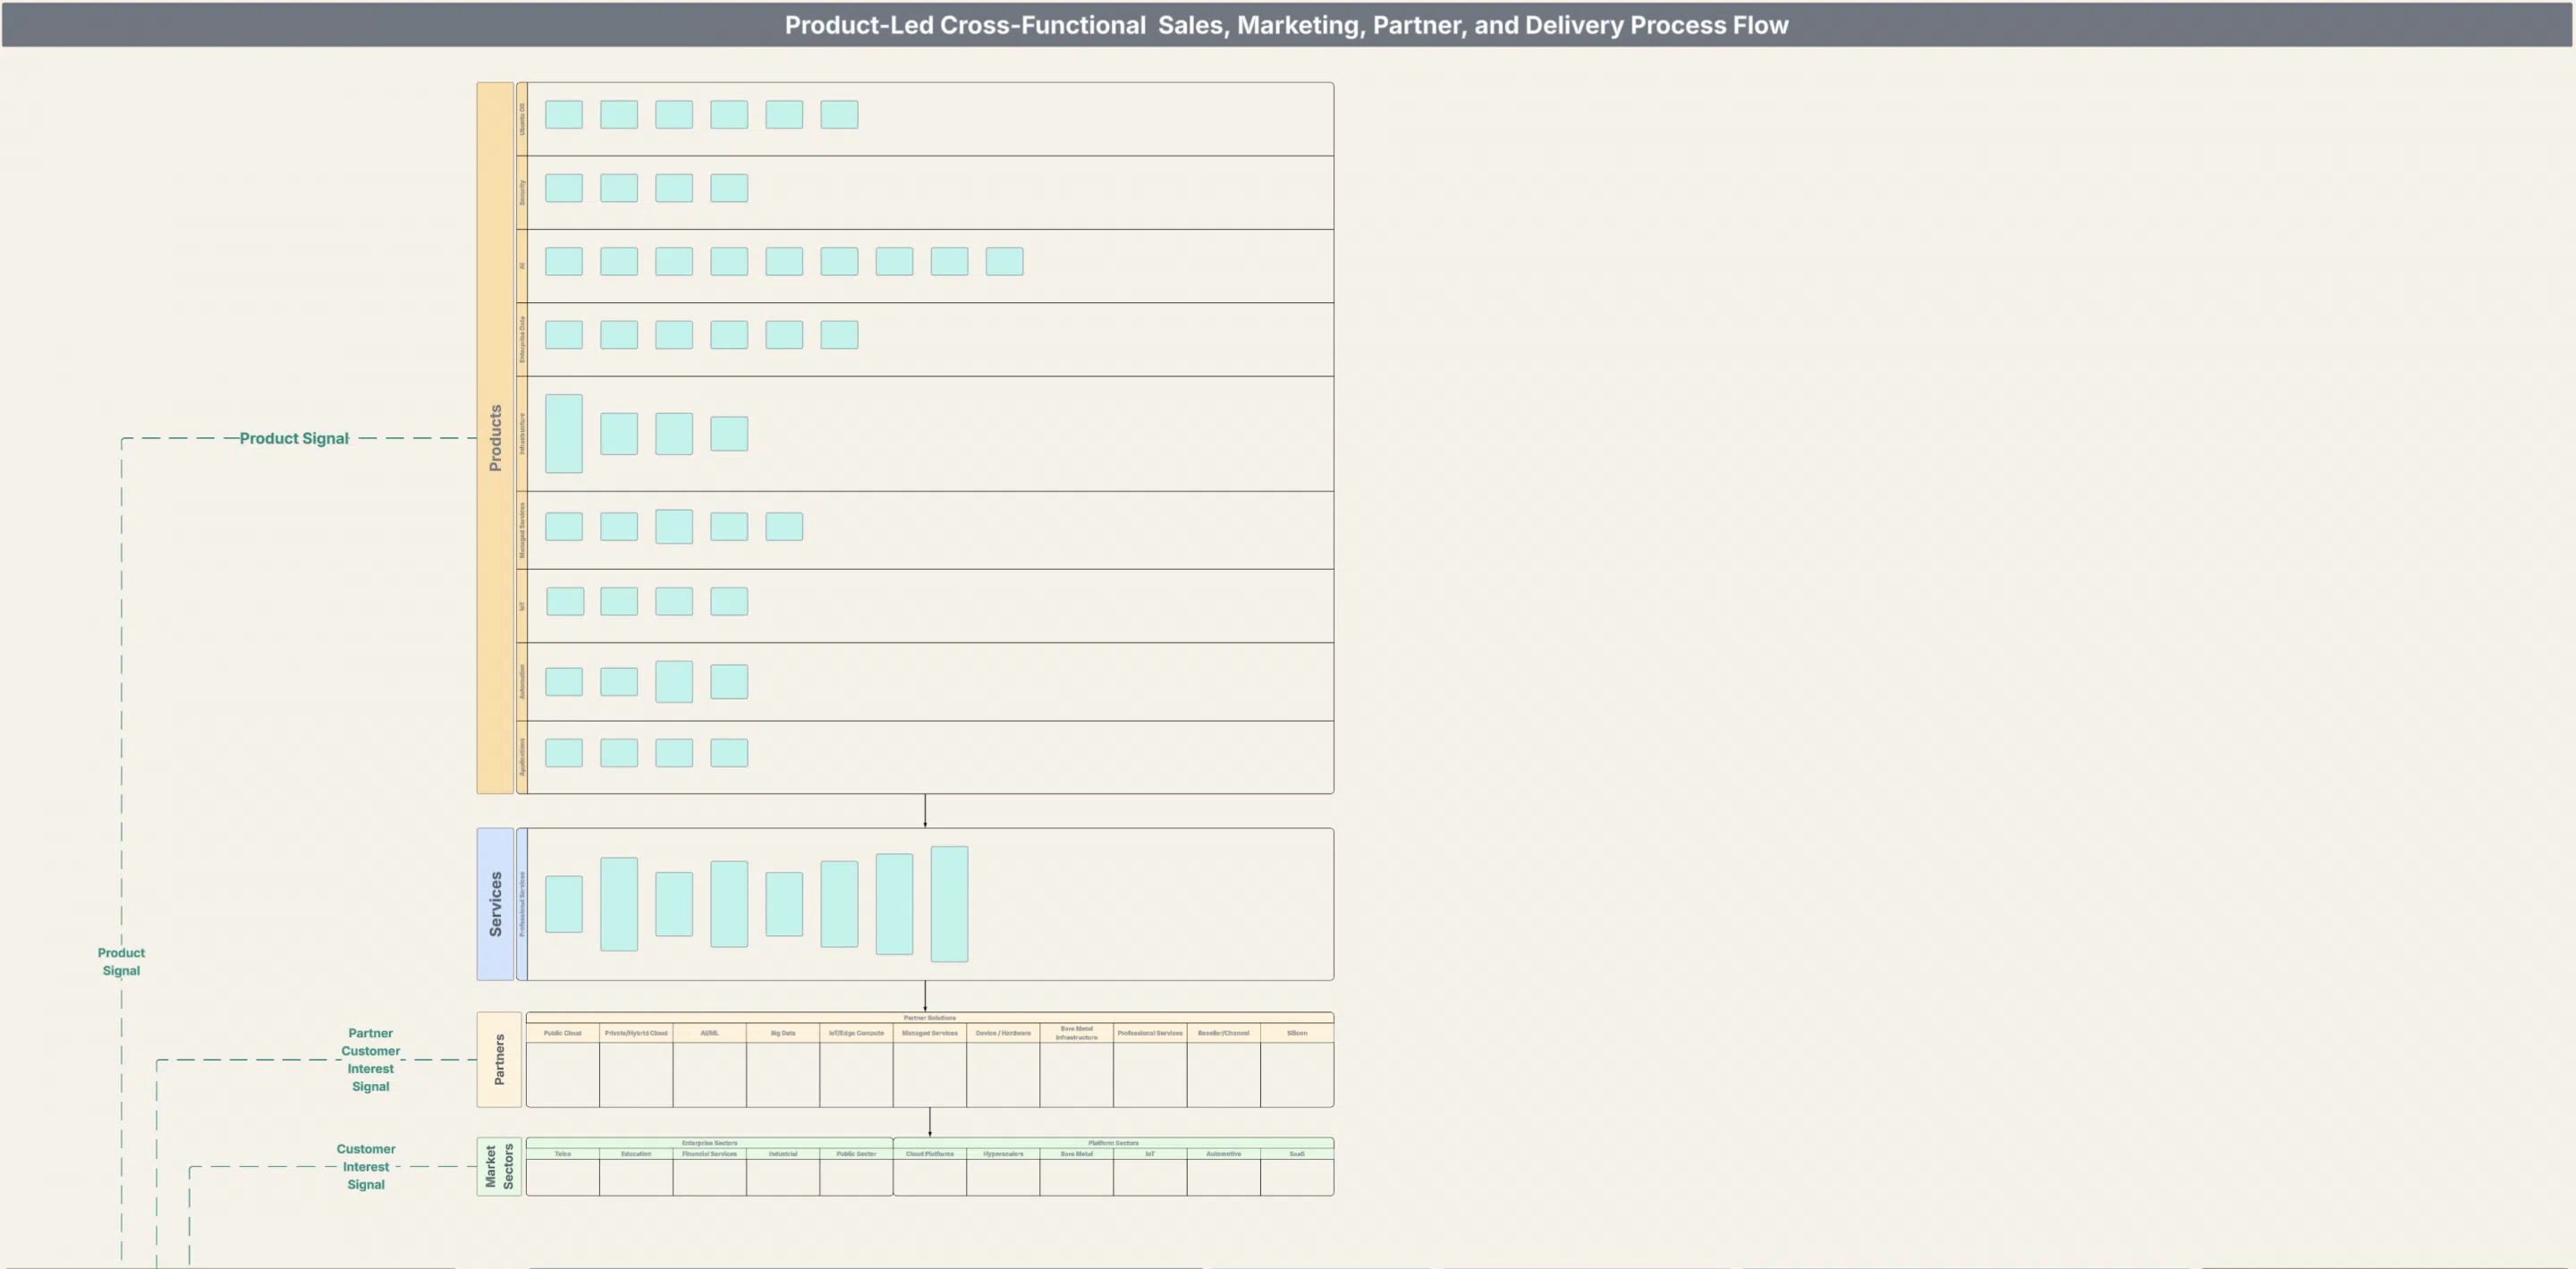
Signals: Interest Indications from Prospects
Prospective customers can be surfaced from activities that are captured within Sales or Marketing motions:
Sales-Sourced:
- Partners and alliances
- Current customers
- Outbound business development teams
Marketing-Sourced:
- Product activities
- Website activities
- Physical events
- Virtual events
- Online community and open-source activities
- Third-party intent data
Customer Success-Sourced:
- Product adoption and expansion
- Advocacy
AI/ML Synthesized:
- Composite signal inference from captured data
A holistic signal capture system with AI/ML synthesis is critical to activating the downstream sales process and customer lifecycle.
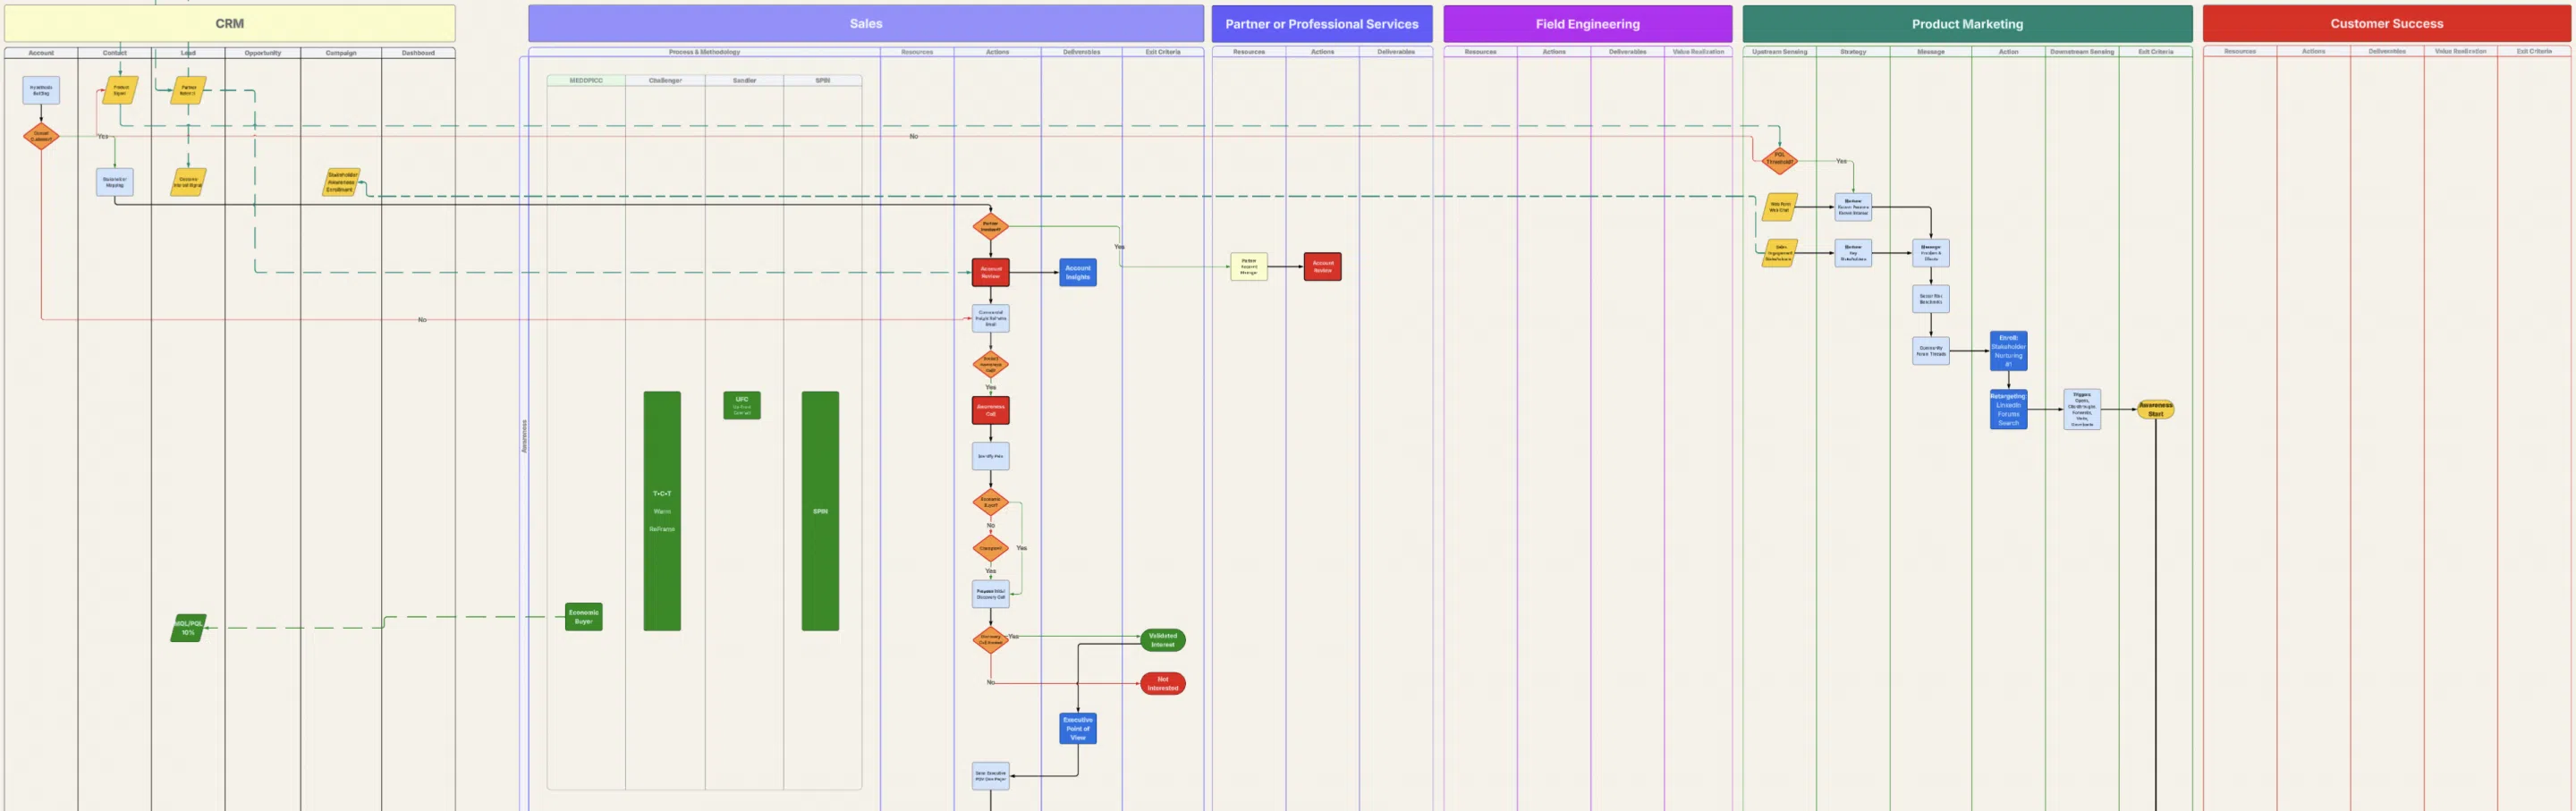
Awareness: Signal Conversion and Problem Framing
The Awareness stage represents the initial point of market engagement where potential customers transition from a Marketing or Sales signal to validated awareness of the seller's solutions.
At this stage, the organization is not yet evaluating vendors or solutions; instead, it is developing an understanding of their problem and whether a solution exists, that it has material impact, and that it may warrant further exploration.
This phase is characterized by early Marketing and Sales signal conversion, stakeholder identification, and validated interest.
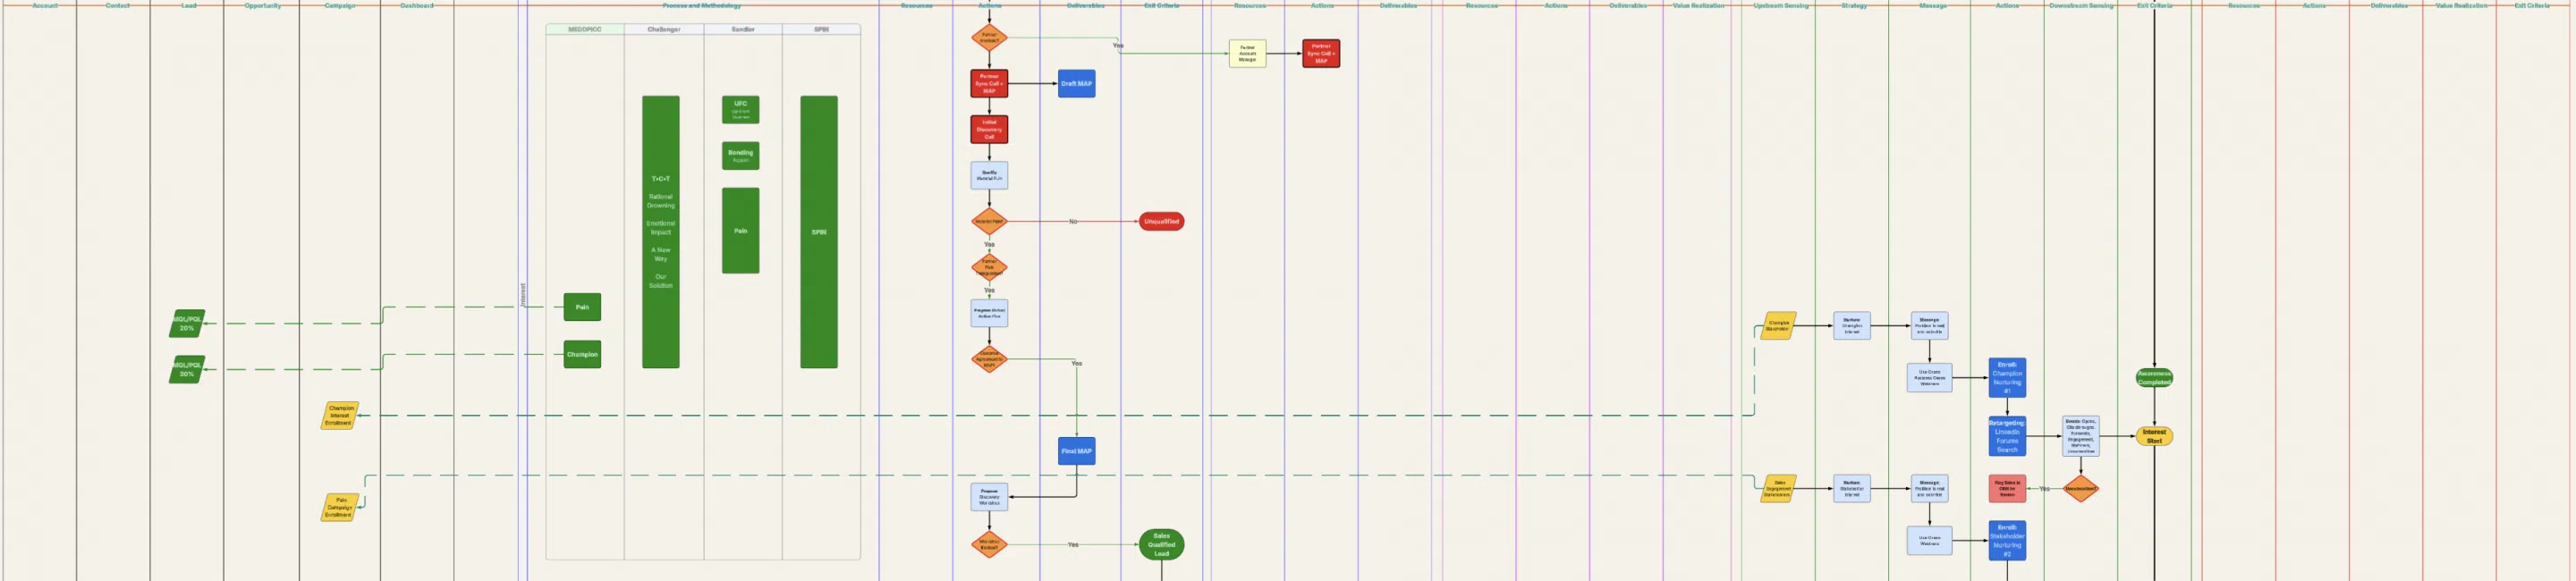
Interest: Problem Validation and Stakeholder Engagement
The Interest stage represents the transition from awareness to deeper problem and solution investigation, where prospect stakeholders begin to engage more deliberately with the problem space.
At this point, the customer acknowledges that the issue is material, but has not yet committed to a formal evaluation or decision process.
The focus shifts from validated interest to a validation that the problem is real, well-understood, and worth solving, while deepening engagement with stakeholders experiencing and solving the problem.
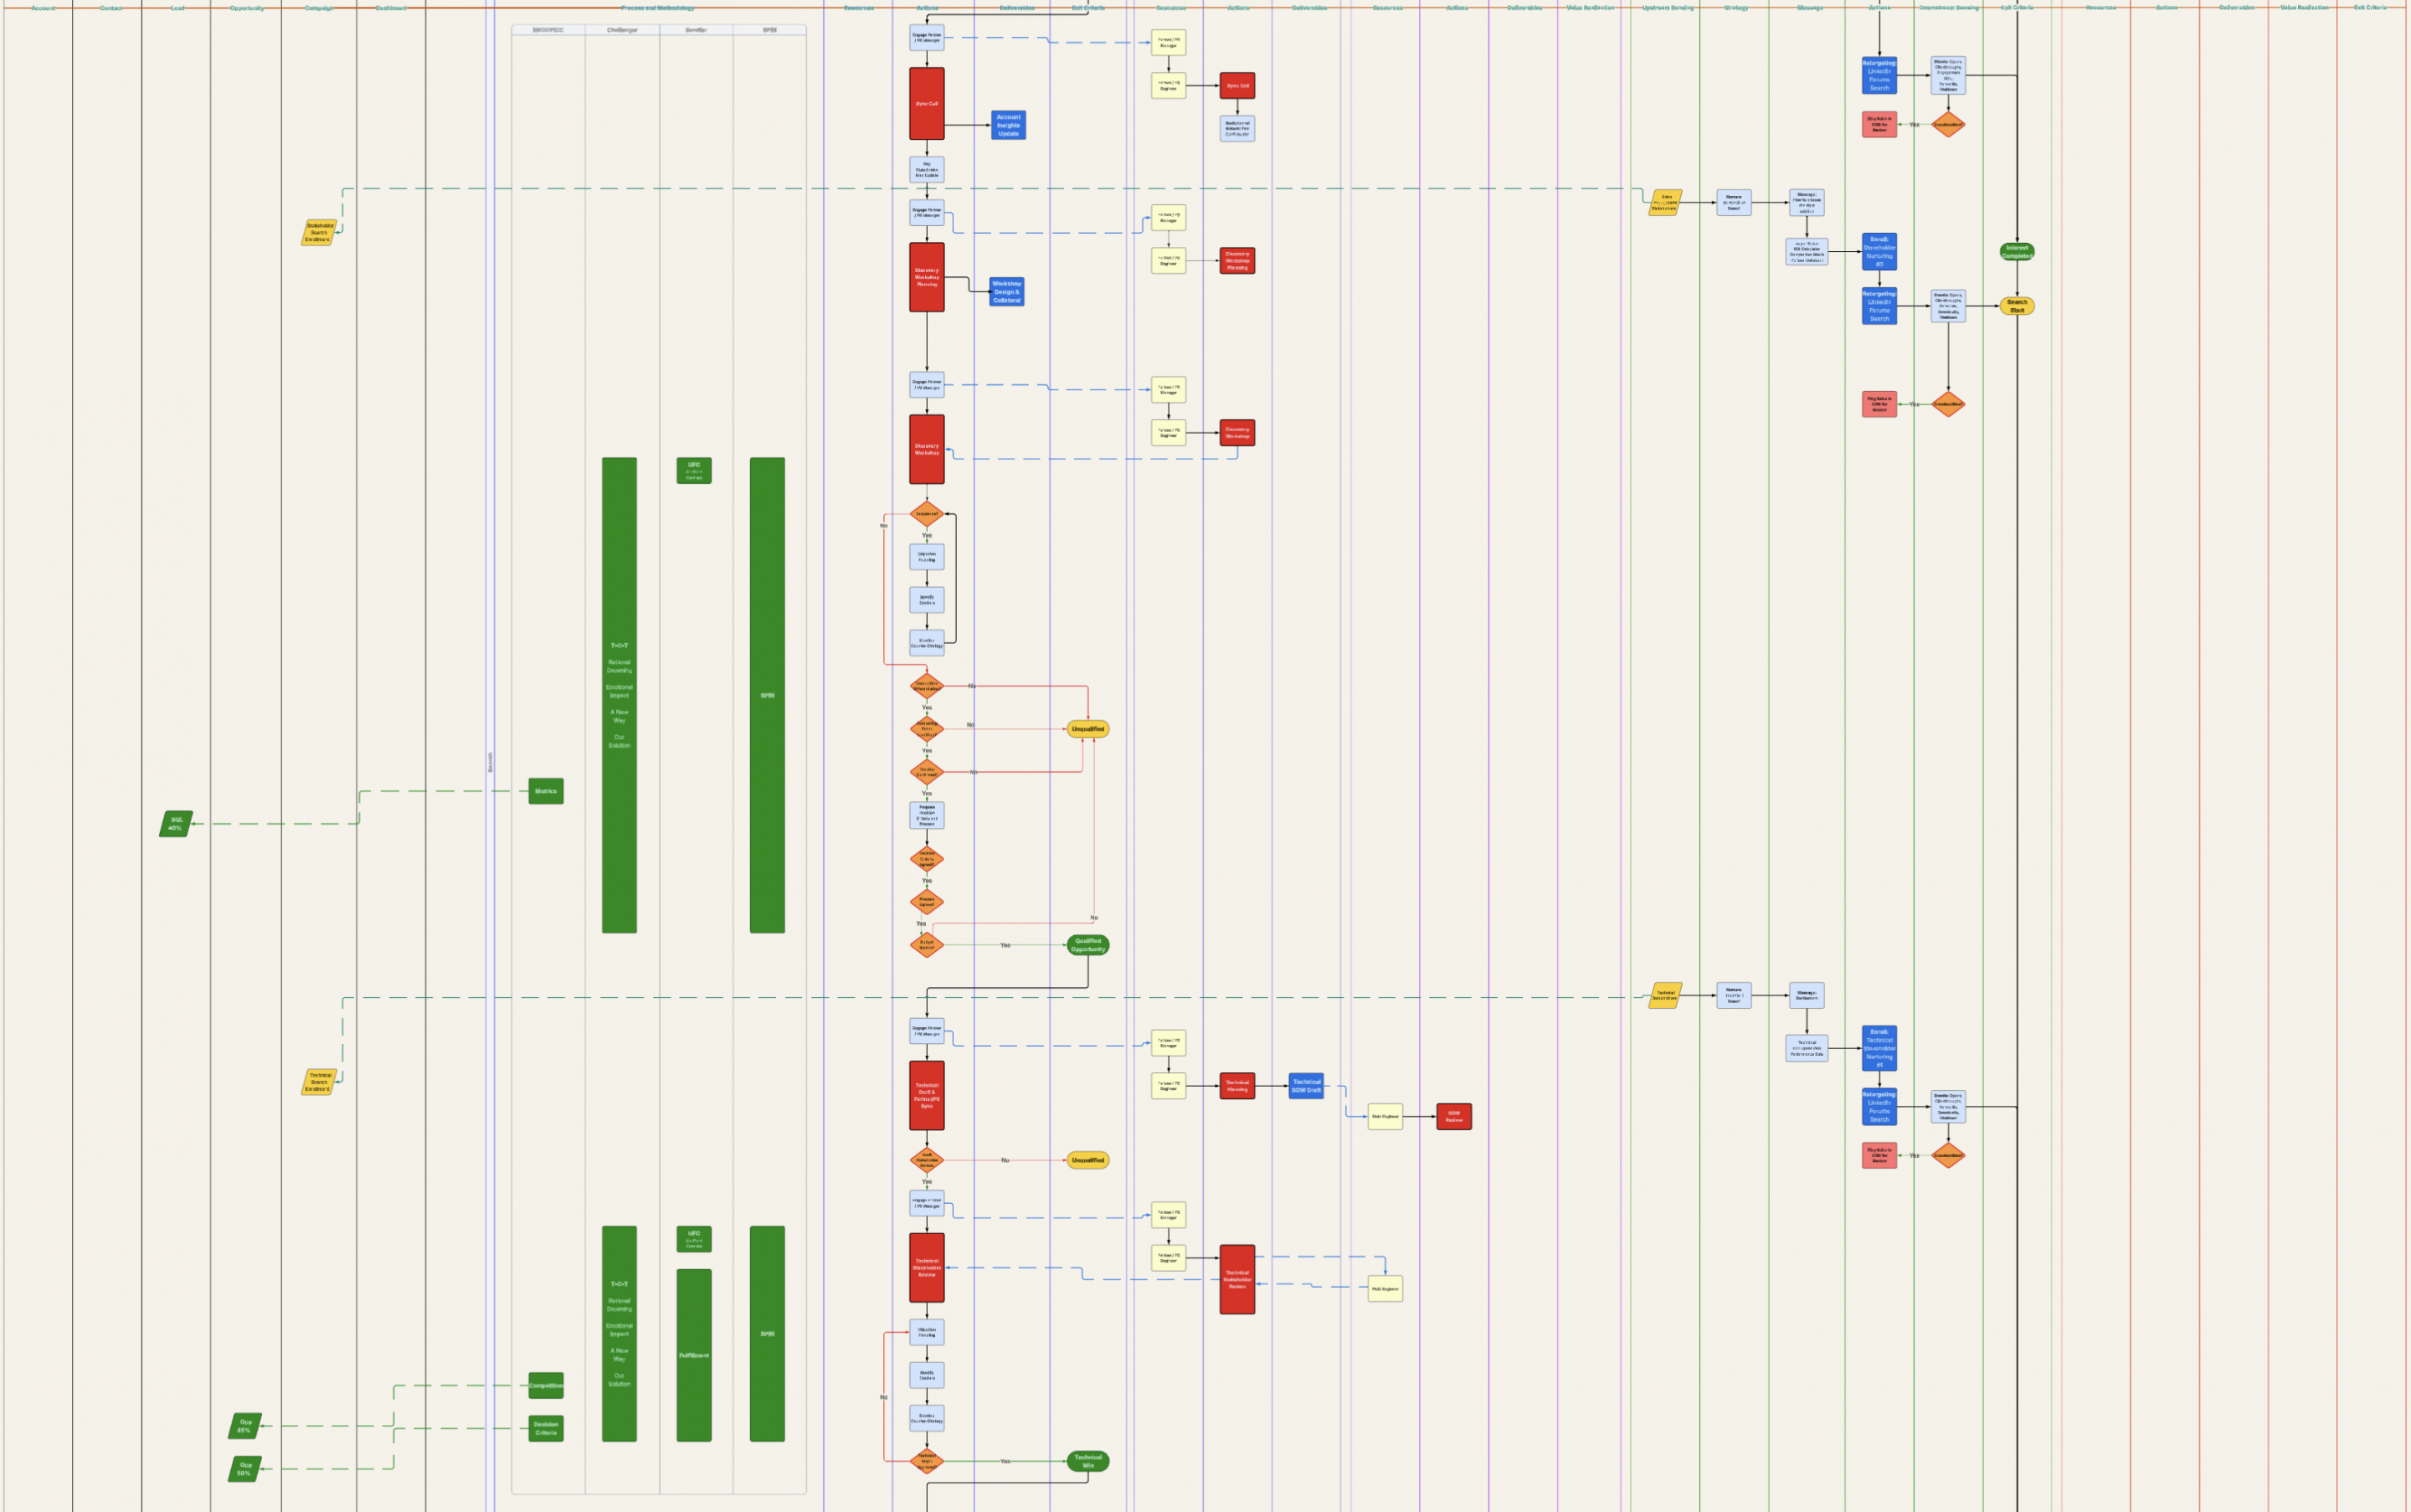
Search: Solution Framing and Initiating Evaluation
The Search stage represents the point at which the customer transitions from problem validation to actively exploring potential solution pathways.
Having established that the problem is real and material, stakeholders investigate how it can be solved, what approaches exist, and the criteria that should be used to evaluate their options.
This stage is characterized by structured information gathering, competitive analysis, and the initial creation of their decision process.
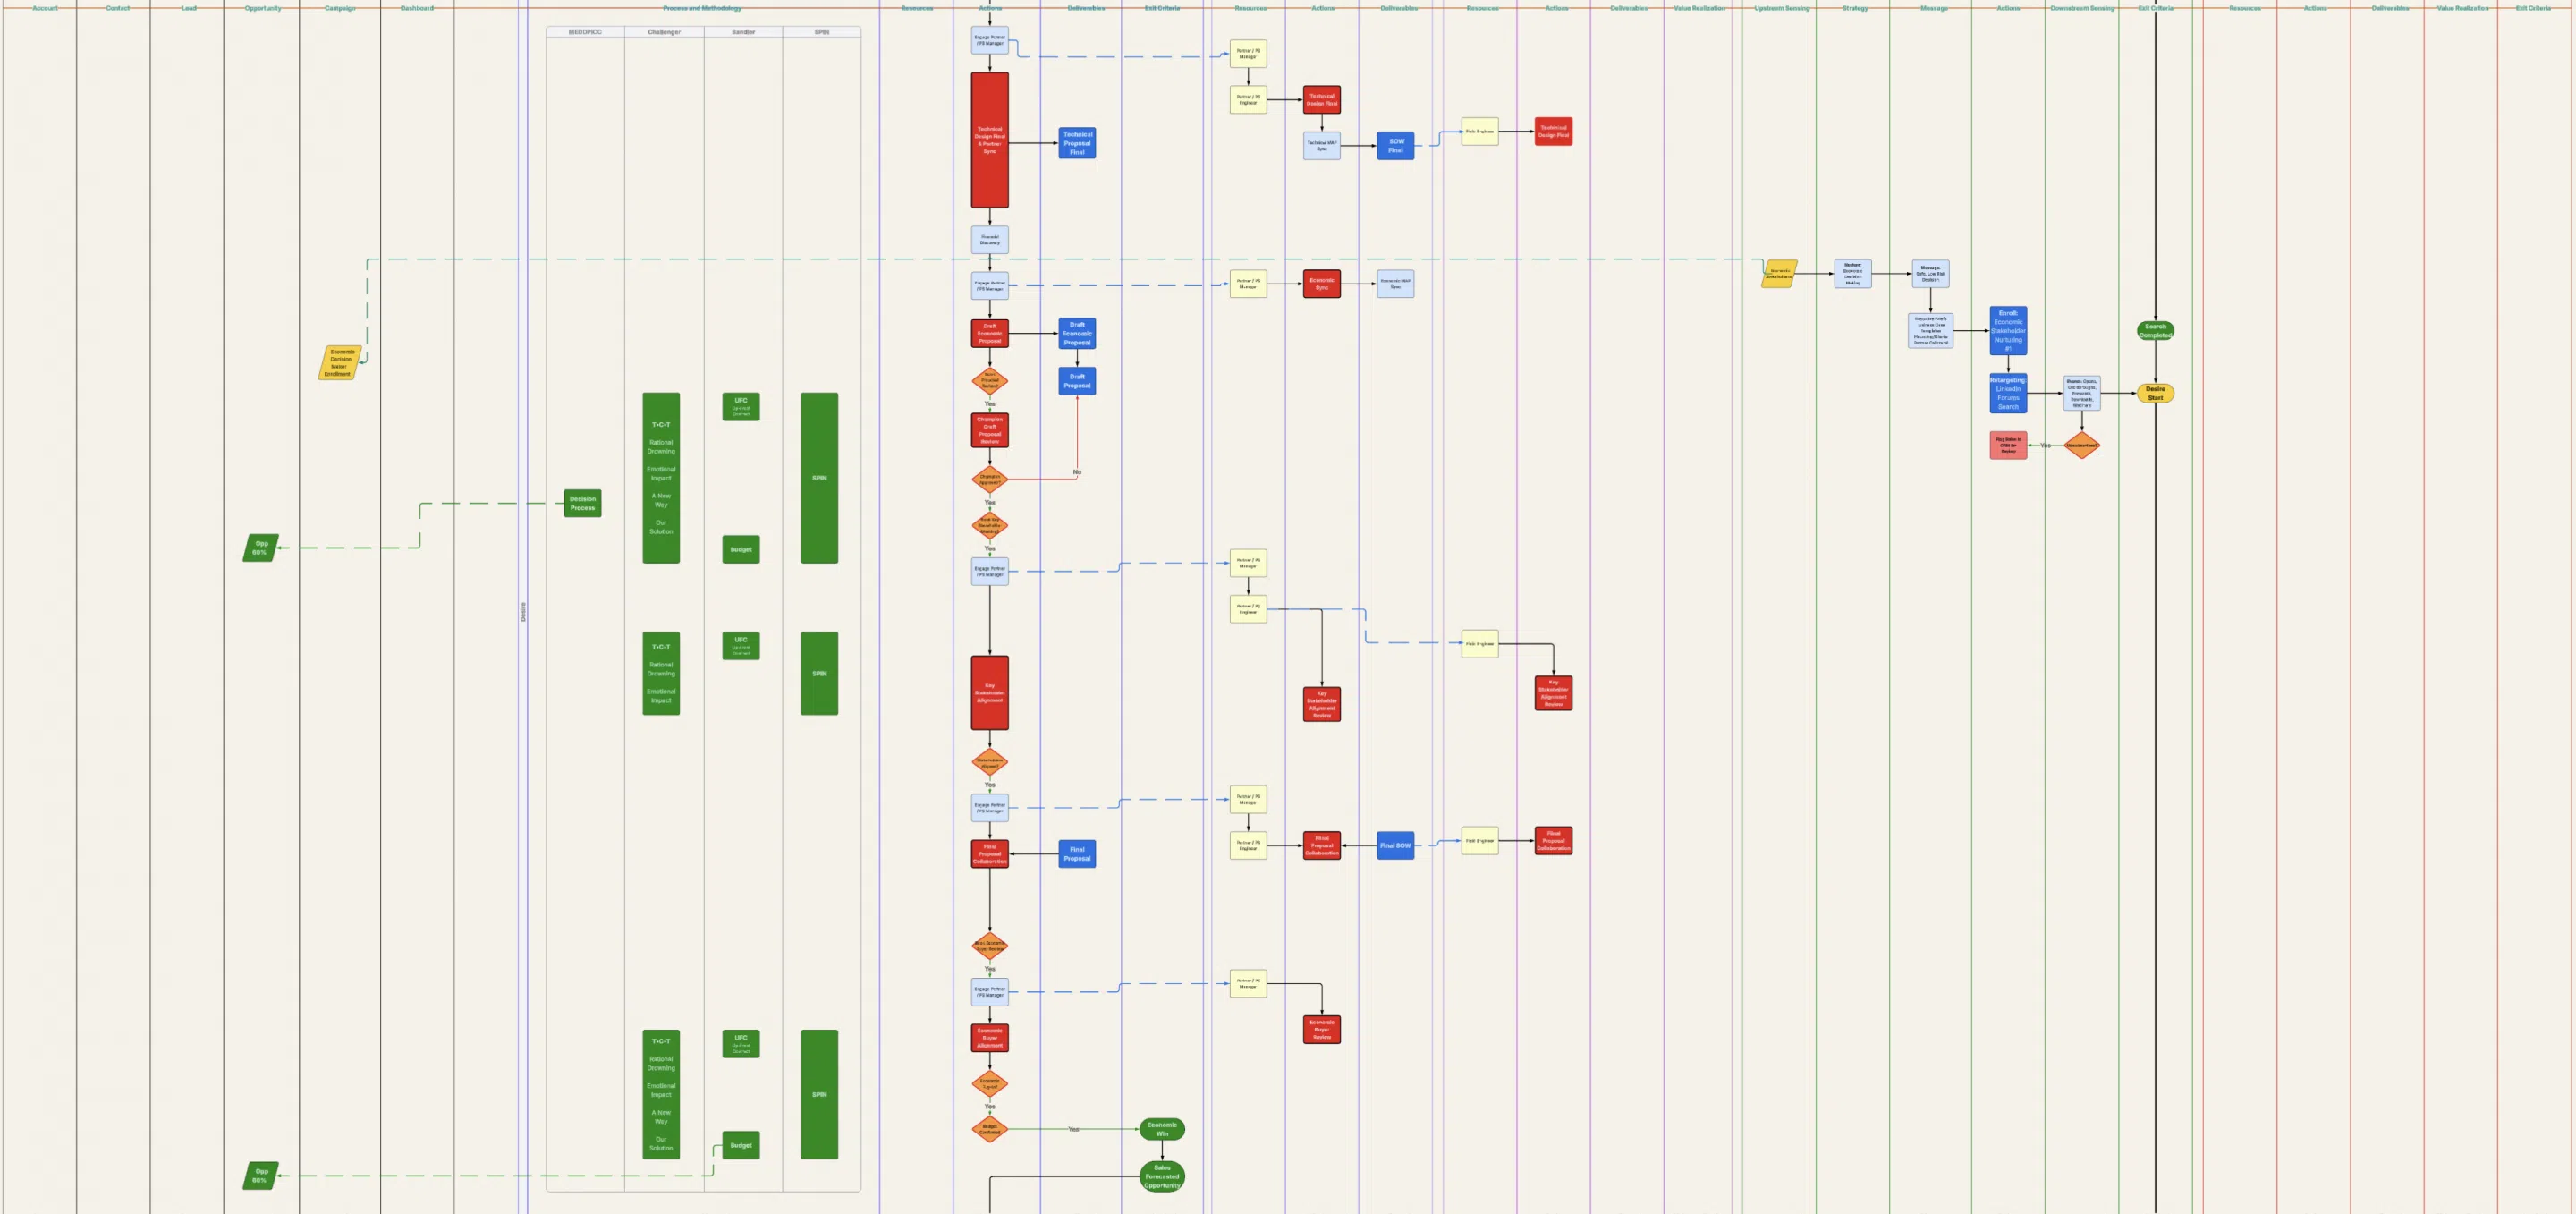
Desire: Business Case and Decision Process Alignment
The Desire stage represents the transition from initial solution review to decision process commitment, where stakeholders begin to consider the seller's solution as their preferred solution and build the internal justification required to proceed.
At this point, the prospect is no longer simply comparing options. They are working to validate that the seller's solution delivers sufficient economic and strategic value, and is technically suitable to justify their investment.
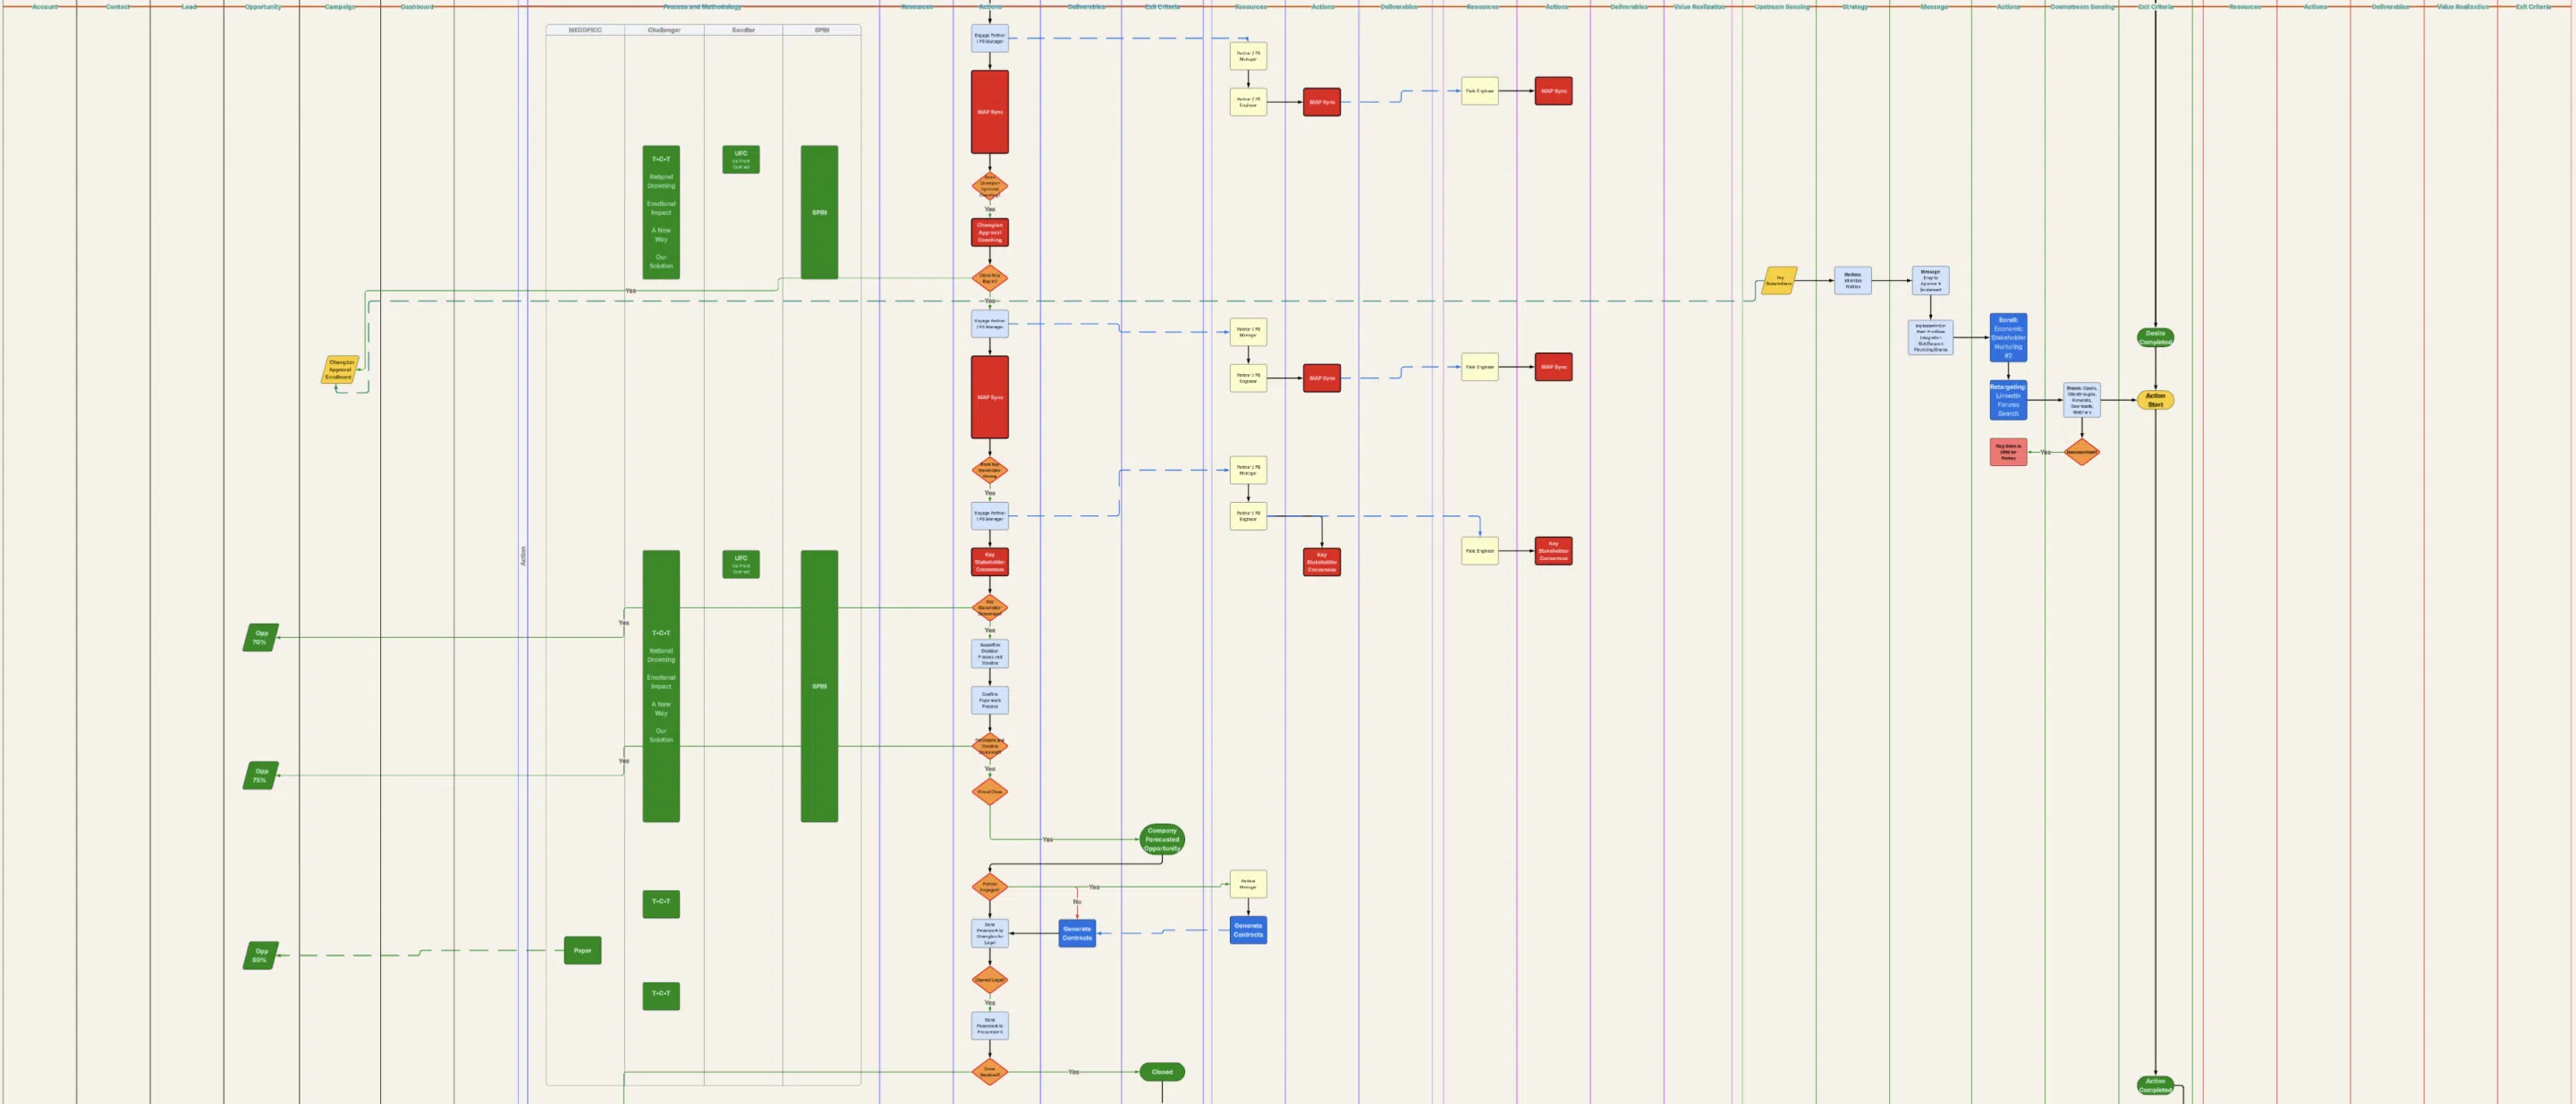
Action: Execution, Champion Commitment, and Commercial Closure
The Action stage represents the point at which a fully qualified and aligned opportunity is converted into a formal commercial agreement and execution begins.
At this stage, the champion and other key stakeholders have completed their evaluations, secured internal alignment, and is prepared to proceed with procurement and implementation.
The focus shifts from solution validation, desired outcomes, and internal alignment to execution discipline, risk mitigation, and ensuring that all commercial, legal, and operational requirements are satisfied to finalize the transaction.
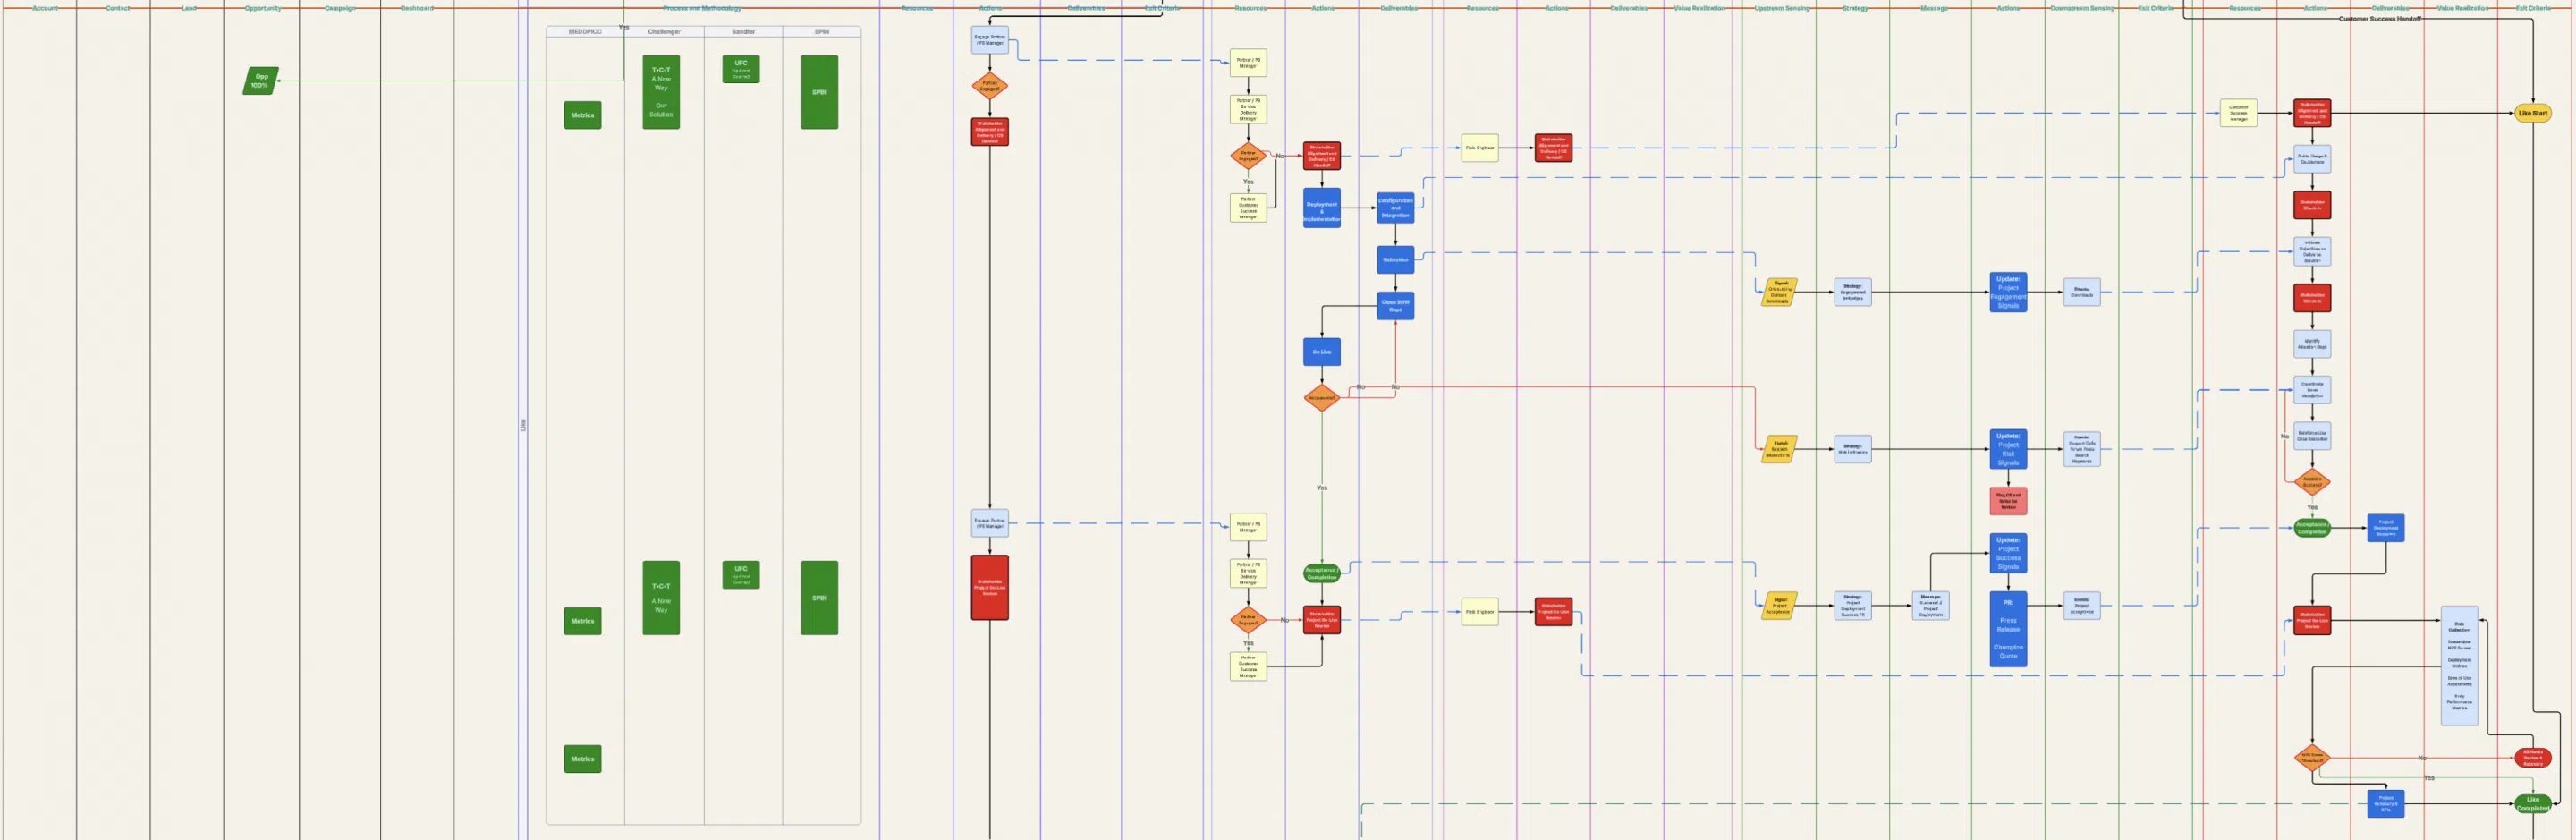
Like: Solution Adoption, Early Experience and Outcome KPI Collection
The Like stage represents the customer’s first real validation of the purchase decision, based on actual experience with the solution.
At this point, the focus shifts from sales execution to delivery, adoption, and early value realization.
The customer is actively using the product or service and forming a judgment based on whether it meets, exceeds, or falls short of expectations.
Solution delivery teams deploy; customer success teams ensure objectives are met; and marketing teams monitor external signals for project success and risk.
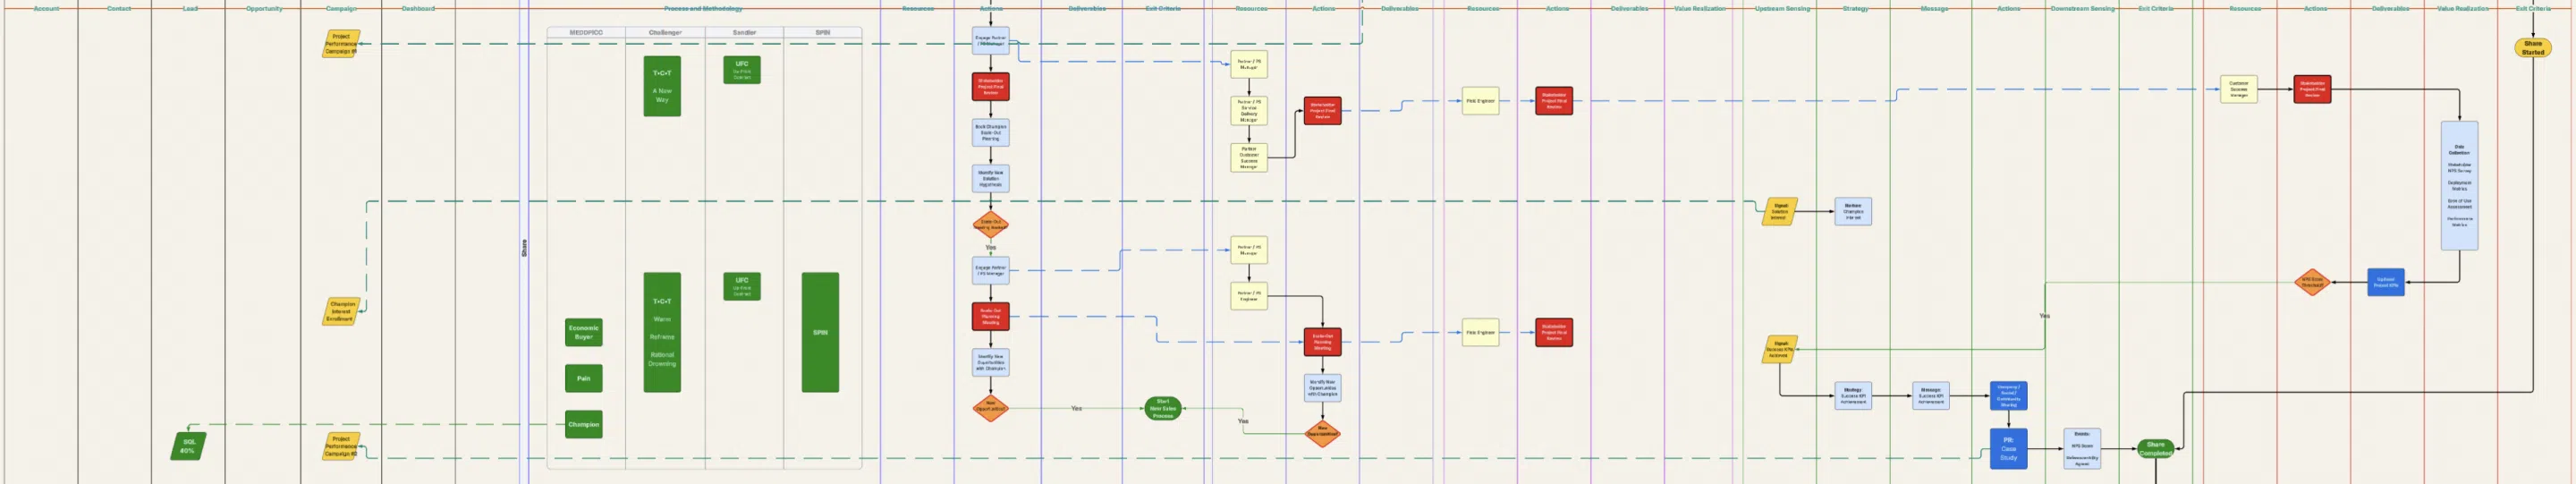
Share: Customer Advocacy, Signal Amplification, and Market Influence
The Share stage represents the point at which customer experience begins to influence the market.
Having validated early value through real-world use, stakeholders actively or passively communicate their experience to others, creating new signals that feed back into the top of the lifecycle.
This stage transforms initial customer experiences and project KPIs into broader market awareness, credibility, and demand generation.
Once the customer's positive experiences are validated, Sales can re-enter the sales cycle, transitioning from "Land" to "Expand" of the solution's use, and/or exploration of new opportunities and transitioning closing on ACV to growing customers' CLTV.
Love: Loyalty, Expansion, and Revenue Compounding
The Love stage represents the long-term outcome of a successful customer lifecycle, where the relationship evolves from satisfaction to loyalty, trust, and ongoing partnership.
At this point, the customer is not only achieving sustainable value from the solution, but both the customer and seller become invested in each other's success.
This stage is where Customer Lifetime Value is fully realized through retention, expansion, and development of a strategic partnership.
Roadway Lighting and Smart Lighting Controls Analysis
I developed a detailed cost-benefit model to accurately assess:
- Current-state of municipal streetlighting operating costs and GHG footprint
- Pre- and post- operating costs and GHG footprint of LED retrofit projects
- Pre- and post- operating costs and GHG footprint of smart lighting controls projects
- The impact of the effects of dimming on streetlight asset lifecycles
- This model uses municipal Open Data streetlight assets, ANSI RP-8 roadway classification and dimming standards, and the specific utility rate plan for each city to accurately assess costs and benefits.
It also adapts to self-financed budget appropriations, bond issues, or energy services contract financing options.

Cost-Benefit Analysis of Smart Lighting Controls
Performance Dashboard Design
Performance Dashboard Design
I designed this KPI performance tracking dashboard to illustrate:
- Top level revenue KPIs
- Revenue KPIs
- Product and Community-based marketing signals
- Customer Success metrics
- Organizational KPIs
- Forecast Health tracking
- Reporting
- AI-based data analytics
Balanced Scorecards are generated from Settings options that define company goals and objectives.
Marketing Collateral Design & Development
I designed and created the product catalog and all of the content within it in Adobe InDesign using Adobe Illustrator, Pixelmator Pro, SketchUp 3D, and LucidChart.
Features include:
- Hyperlinking table of contents to sections
- Creating reusable categorized media library to enable team-based maintenance and readability
- Structured formatting for scalability with new products

Product and Solutions Guide Design
Website Design & Development

Your content goes here. Edit or remove this text inline or in the module Content settings. You can also style every aspect of this content in the module Design settings and even apply custom CSS to this text in the module Advanced settings.
I designed, co-developed, maintained, and created all of the content for this client's website for Smart City IoT solutions.
The site runs on WordPress and I used the Divi CMS for building the site.
Site traffic, search click-through, and content engagement are up over 1,500% year over year as of February 2026.
Competitive Analysis
I continuously monitored and maintained product functional scope changes among 12 market competitors.
Through research and freedom of information requests, I was also able to monitor competitor's pricing strategies.
The model uses a weighting so that for any competitive bid, we could quickly assess over 40 different functional attributes x 12 competitors for any specific bid requirements and determine:
- Our probability of success
- The effects of pricing and functionality vs bid scoring methodology
This enabled us to decide whether to pursue a public tender, what our pricing strategy should be, and respond to changes in our competitive landscape.

Your content goes here. Edit or remove this text inline or in the module Content settings. You can also style every aspect of this content in the module Design settings and even apply custom CSS to this text in the module Advanced settings.
Public Tender Design and Analysis

Your content goes here. Edit or remove this text inline or in the module Content settings. You can also style every aspect of this content in the module Design settings and even apply custom CSS to this text in the module Advanced settings.
I created this bid scoring analysis after writing and submitting an RFP on behalf of a client.
I used a competitive analysis model I had created earlier to predict our bid score ±5% and a #1 or #2 position out of 10 vendors.
We were surprised that we had not been invited to the short-list bidders meetings, or had been awarded the contract.
I submitted a freedom-of-information request to collect the city's bid scoring data and competitor responses. My further analysis showed that we had submitted the top-scoring bid.
After discussions with the city, they offered a significant monetary settlement and an admission they had failed to properly award the bid.
Technical Diagram Design
This is a wiring diagram I created in LucidChart during the development of an installation and user guide, and as an insert into a technical specifications cutsheet.

Your content goes here. Edit or remove this text inline or in the module Content settings. You can also style every aspect of this content in the module Design settings and even apply custom CSS to this text in the module Advanced settings.
GIS Modeling

Your content goes here. Edit or remove this text inline or in the module Content settings. You can also style every aspect of this content in the module Design settings and even apply custom CSS to this text in the module Advanced settings.
This is a a GIS (Geographic Information System) model developed to optimize the placement of sensors.
The model uses customer asset inventory and location for accuracy.
The outcome of this model was:
- Validation of project costs
- Rapid generation of accurate price quotes for projects of any size
- Adapts to any customer environment using open data or structured internal asset inventory
3D Modeling
I developed this 3D model using Trimble SketchUp 3D to create a series of illustrations.
These images were used to help customers visualize the aesthetic impact of a deployed product.

Your content goes here. Edit or remove this text inline or in the module Content settings. You can also style every aspect of this content in the module Design settings and even apply custom CSS to this text in the module Advanced settings.