

Exit criteria are the foundation of forecast quality
Forecast quality is the operational heart of the whole model. Every stage contains critical decision points and ends in an Exit Criteria representing a Stage where the completed critical decision points contribute to each Stage and automate forecast quality when rendered in a CRM system:
Validated Interest, Sales Qualified Lead, Qualified Opportunity, Technical Win, Economic Win, Sales Forecasted Opportunity, Closed-Won, validated Go-Live and Start New Sales Process are measured, evidence-based gates against critical events within each stage.
Two of those deserve separating, because they are routinely confused. Desire ends in a Sales Forecasted Opportunity: that is the seller's forecast, not the company's commit. The commit is earned one stage later, at the Virtual Close in Action: a dry run of the entire closing sequence designed to surface the hidden obstacle before it costs you the quarter. Clearing it is what promotes a deal from sales-forecasted to company-forecasted.
Critical channel partner events can be managed by direct Sales reps or channel partner managers for co-partner deals; channel-led deals can be updated in a partner CRM portal for maximum visibility.
Improving Forecast Quality
The primary goals for all Sales leaders are:
- Deliver dependable forecasts to the organization
- Grow booked and recognized revenue, ACV, and CLTV
- Minimize the expense-to-revenue ratio
- Minimize the average sales cycle period
- Hire and retain great talent for their teams
The primary goals of Marketing leaders are:
- Scale Signal monitoring across markets
- Create Awareness
- Nurture and Identify early Interest (MQL)
- Nurture and support Sales' SQL conversion to Opportunities
- Nurture and support Sales' Opportunities through to close
- Monitor Customer Success signals through deployment
- Minimize friction for prospective buyers, partners, and existing customers
- Improve organizational scale through customer self-service and self-support
- Publicize success
- Nurture existing customers into new MQLs across both expansion motions, a different solution (Whitespace Expansion) and the unscoped phases of the same one (Project Expansion), to grow the company's solution footprint
If a Marketing leader delivers on all of their goals but cannot deliver quality convertible MQLs, their days are numbered. If a Sales leader delivers on all of their goals but cannot deliver dependable forecasts, their days are numbered. The key to delivering forecast quality is through a repeatable RevOps "flywheel":
- Creating a Customer Lifecycle funnel mapped to each of its Stages, in parallel to your Sales Process funnel
- Establishing Exit Criteria for each Stage in the Sales Process and Customer Lifecycle (e.g., integrated MEDDPICC/Challenger/Sandler/SPIN, and AISDALS/L)
- Adding common customer Decision Criteria for each Stage that must be met to exit and proceed to the next
- Adding Pipeline Leakage KPIs for each Stage in the Sales Process and Customer Lifecycle funnels
- Benchmark expected duration per Stage and per product, so velocity analytics can separate designed dwell from a genuine stall. Some stages are long on purpose: Like cannot close until the value window has run: the Final Review falls 60 days after go-live is approved. Without a per-product temporal baseline, leakage KPIs flag healthy deals and hide sick ones.
- Refine your Decision Criteria within each Stage to address leakage
- Surface the integrated Sales Process and Customer Lifecycle into three CRM processes: a Lead process (Awareness through Interest), an Opportunity process (Search through Action, ending at the order), and a Customer Success process (Like through Love). There is no separate SQL process, because Sales Qualified is an Event, not a Stage: booking the discovery workshop raises the conversion, and the Lead converts to an Opportunity once its qualifying steps are complete.
- Bind every Stage step to a real CRM activity, so the step auto-completes when that activity completes with proper linkage, and cannot be ticked manually. This is the control that makes leakage reporting honest: if a step can be self-certified, the leakage report measures reporting behavior rather than deal behavior.
- Create Lead and Opportunity Pipeline Leakage Reports by Stage and Activity to monitor what activities are contributing to wins and the absence of those activities to losses
- Surface the Pipeline Leakage and Sales & Marketing lifecycle KPIs to the CRM dashboard
In this way, Sales and Marketing leaders can quickly diagnose Pipeline Leakage and velocity from MQL to close to MQL in a continuous flywheel, plug the Activity holes causing leaks, remove unnecessary Activities causing friction in the Exit Criteria, and optimize Sales and Marketing efficiency.
Mapping to the Management Dashboard
Once this sales process and customer lifecycle is mapped in to CRM Sales and Marketing workflows, the measurable activities drive the dashboard, and forecast quality is tracked, with the ability to drill down to each deal and expose the events and evidence behind every stage transition: which activity closed which step, when, and who confirmed it.
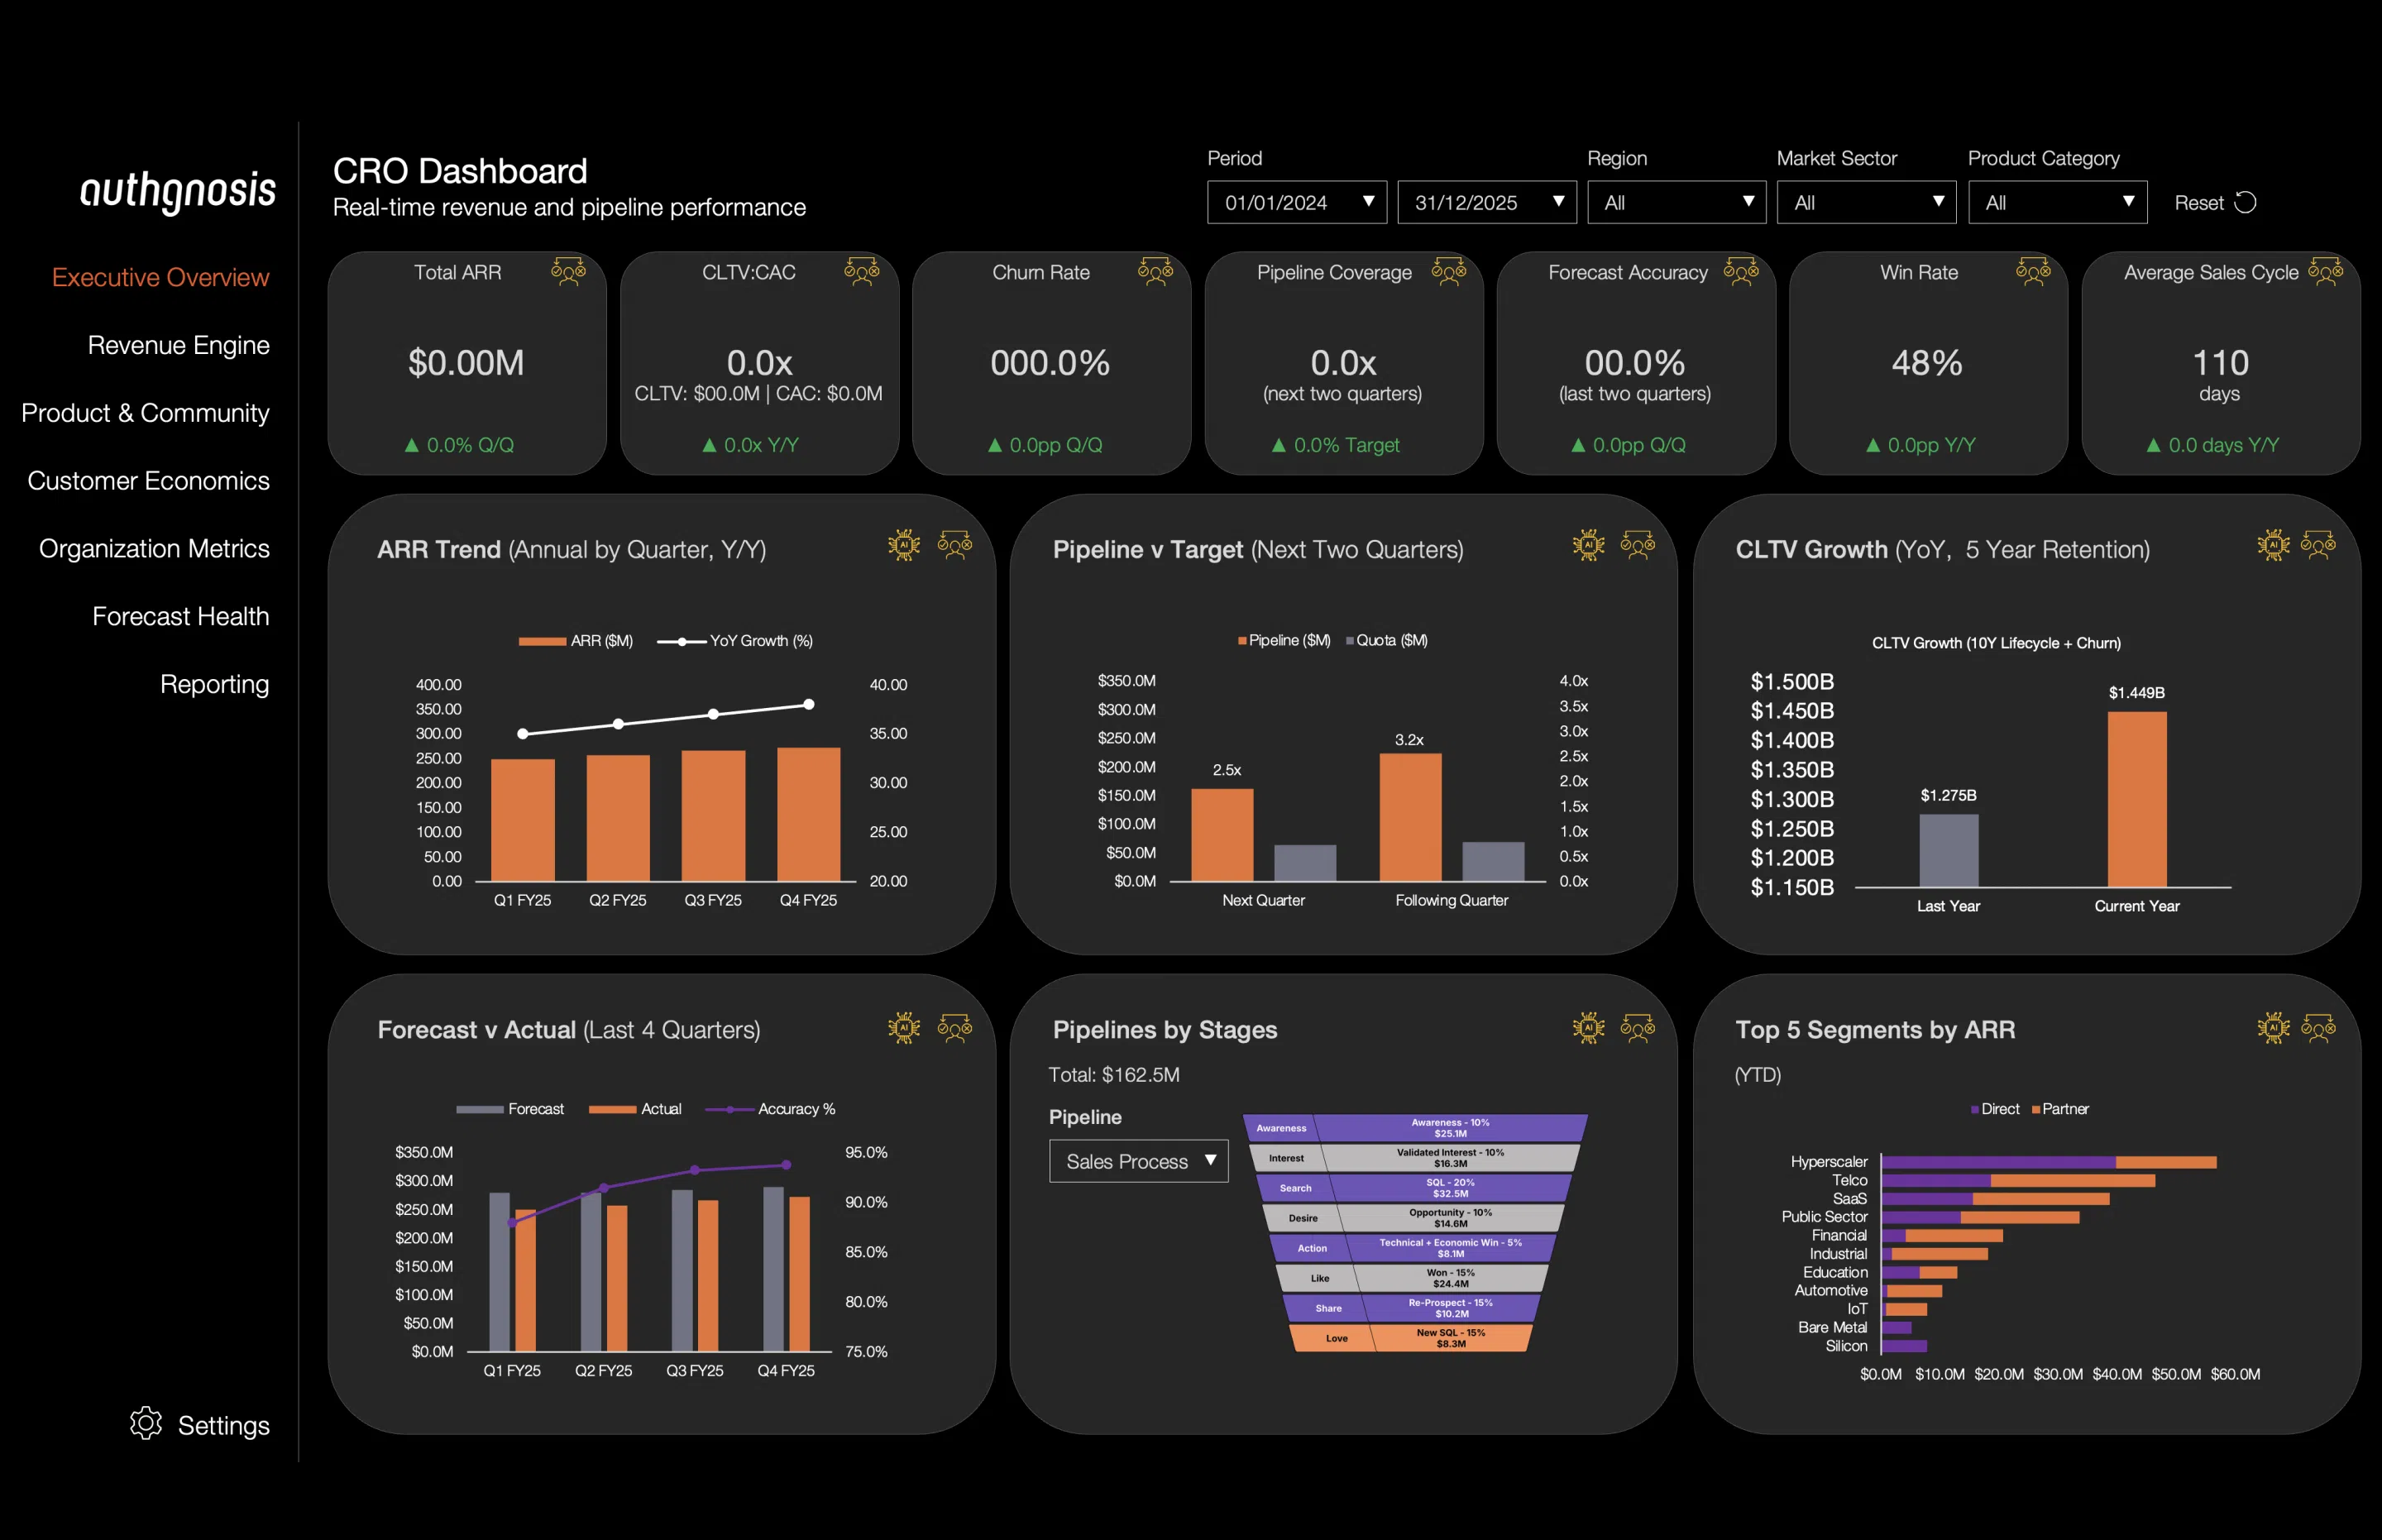
A forecast is only as trustworthy as the criteria met behind each stage transition. When a deal advances because a defined, observable milestone was met and logged, the forecast inherits that evidence.
When deals advance on seller optimism, the forecast becomes fiction. Documenting a sales and customer lifecycle process this way is powerful: it converts "I think this will close this quarter" into "this deal has cleared material pain, a booked workshop, a confirmed timeline, an agreed decision process, a technical win, an economic win, a confirmed budget and a clean virtual close...and here is the evidence for each."
A well-documented process with hard exit criteria also makes coaching possible. When a deal stalls, you can see which gate it failed and why, and you can intervene with the right play.
The loop is the flywheel: A Transition from ACV Funnels to CLTV Growth
The most important property of AISDALS/L is that it doesn't end. It does not end the way a funnel diagram would suggest, either.
Sales responsibility hands over at the close: the Opportunity ends at the order, and Like, Share and Love run in Customer Success. The flywheel continues from there. Customer Success spawns a new expansion MQL for a Whitespace Expansion, or for a phase the original proposal left unscoped. A phase that was scoped but sits behind a go/no-go gate requiring the customer's approval enters as a later-stage Opportunity, rather than being booked as revenue in one deal. Renewals run on a flow of their own, separate from the Sales and Customer Success processes and sitting under the Customer Success team in the lifecycle, and that flow consumes Marketing-surfaced risk and success signals to support retention. By Love there are no Sales actions left at all: Customer Success runs two value check-ins and a risk read, Marketing keeps monitoring online risk, and the lifecycle then returns to Sales to nurture or to rest dormant.
Expansion is not sensed, it is generated. Signals is a scoring subsystem sitting upstream of the seller, not a Stage the process returns to. The next Sales cycle is created as a new Lead deliberately at project completion, once the Final Review is accepted and the customer confirms at the scale-out meeting that it wants to expand. A Project Expansion Lead keeps the account review and the partner check, skips the rest of the Awareness outreach and goes straight to proposing the discovery call, because the company is already known, procurement and legal are already cleared, and a prior champion is already banked. A Whitespace Expansion Lead begins in the Awareness stage as a new customer would, because the fit of a different solution is unproven and the Champion and Economic Buyer may be different for larger organizations.
A linear funnel optimizes a single transaction. AISDALS/L optimizes a relationship. The relationship is where enterprise economics live: land, adopt, prove value, advocate, expand, repeat. Proving it is two separate events, not one. The Go-Live Review confirms operational success: live, working, actually adopted, and measures no value at all.
The Final Review, 60 days after go-live is approved, is the value measurement: achieved value and actual pain reduction, against the exact success criteria agreed back in Desire. Customer-measurable KPIs simply do not exist before then, which is why that number, and not enthusiasm, is what makes the expansion conversation credible.
This is the punchline, and it comes down to the metric you want to optimize.
Measured on Annual Contract Value, the first deal looks like the finish line, and a funnel that ends at "Action" looks complete.
Measured on whitespace growth and increasing Customer Lifetime Value within an existing customer, that same deal is the starting line. A funnel that ends at "Action" is systematically under-managing the most valuable part of the business: the renewal, expansion and advocacy flywheel that compounds CLTV and recruits the next cohort of buyers through the Share motion.
Expansion is two motions, and conflating them is a mistake: Whitespace Expansion cross-sells a different solution to a delivered customer, where fit is unproven and it must genuinely re-qualify; Project Expansion grows the same solution into the phases the original proposal left unscoped. Both spawn their Lead at project completion and both qualify or disqualify through the Lead process, a deliberate symmetry, because an MQL is cheap and the rigour belongs at qualification.
One rule governs all of it, and it is the most on-topic rule in the model for anyone who cares about forecast quality: an Opportunity is never spawned automatically. Automation may create the MQL – the cheap, unqualified, foundational state, where generating one early costs nothing. Promotion to Sales Qualified stays a human judgement call. Automation that manufactures qualified pipeline manufactures unearned forecast, which is the exact failure this whole apparatus exists to prevent.
What holds the two halves together is a single value arc: pain qualified at Interest, materiality quantified at Search, priced and agreed into success criteria at Desire, proven against those same criteria at Like. That arc is why the forecast is defensible on the way in, and why the expansion is credible on the way out.
AISDALS/L creates a cross-functional flywheel with a managed process – named owners, defined actions and hard exit criteria – rather than an accident that happens to good products.